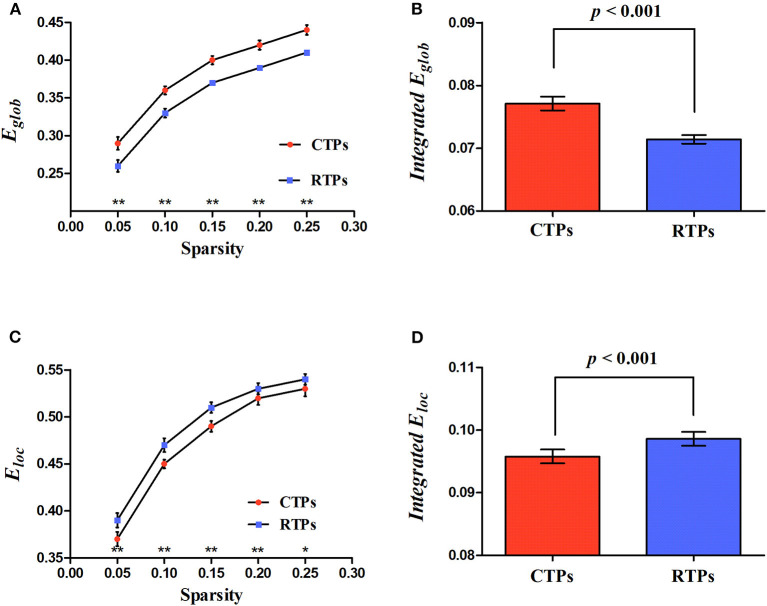
Figure 3.
Illustration for the global parameters changing with sparsity (A,C) and significant differences in integrated network parameters (B,D) at resting state. Eglob, global efficiency; Eloc, local efficiency. The asterisk (* and **) indicates a significant between group difference at p < 0.05 and p < 0.01.

