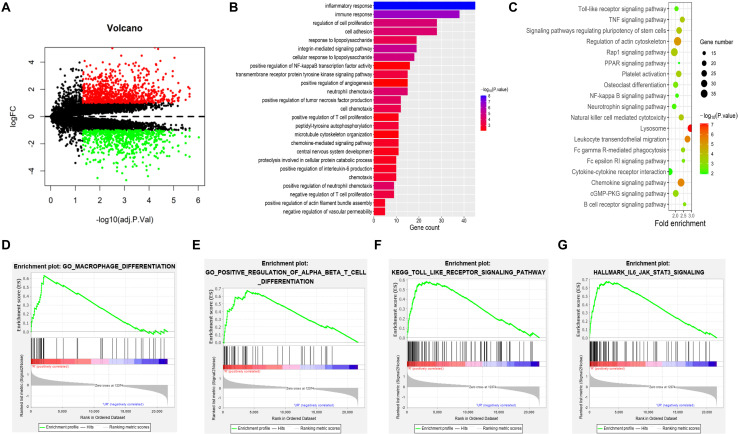
FIGURE 1.
DEG and functional enrichment analyses. (A) Volcano plot of DEGs in IAs [p < 0.05 and log2| (fold change)| > 1] in the GEO IAs transcriptional profiles. There were 11 UIAs and 13 RIAs. (B–G) Visualization of the enrichment results. (B) GO terms are colored by the p value, and terms containing more genes tended to have a more significant p value. (C) KEGG pathway terms are colored by the p value, and terms containing more genes tended to have a larger size. (D–G) GSEA results show that macrophage differentiation, positive regulation of alpha beta T-cell differentiation, Toll-like receptor signaling pathway, and IL6–JAK–STAT3 pathway were enriched in RIAs compared with UIAs. DEGs, differentially expressed genes; GEO, Gene Expression Omnibus; IAs, intracranial aneurysms; UIAs, unruptured intracranial aneurysms; RIAs, ruptured intracranial aneurysms; GO, Gene Ontology; KEGG, Kyoto Encyclopedia of Genes and Genomes; GSEA, gene set enrichment analysis.

