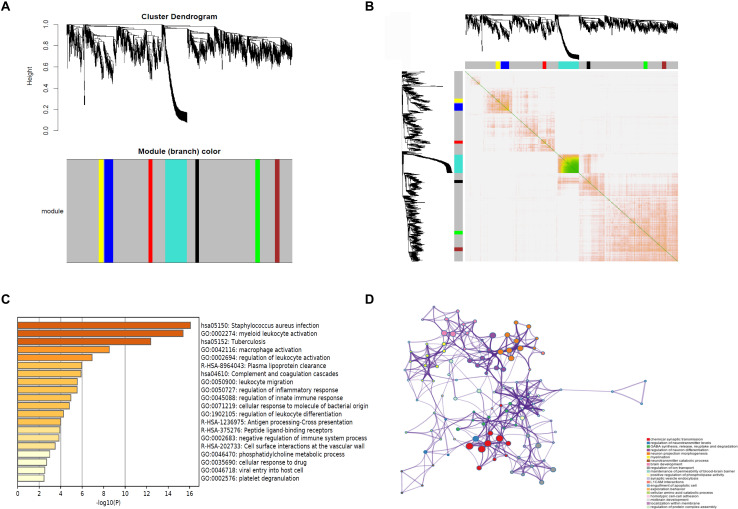
FIGURE 3.
WGCNA of DEGs. (A) Cluster dendrogram and module assignment for modules from WGCNA. X axis represents genes, and Y axis represents height of the gene tree. The colored horizontal bar below the dendrogram represents the module that contains a group of highly connected genes. (B) Clustering of the DEGs by topological overlap shows that seven gene modules characterized by distinct expression patterns comprised highly coregulated genes. The color intensity in the heatmap is proportional to the interaction strength between two genes with green color for the strongest interaction and white color for no interaction. The seven modules are represented by the color bars along the X and Y axes. The blue and turquoise modules represent the top two modules. (C) The genes in the blue module are enriched in myeloid leukocyte activation, macrophage activation, and regulation of leukocyte activation. (D) The genes in the turquoise module are related to chemical synaptic transmission, regulation of neurotransmitter levels, and regulation of neuron differentiation. WGCNA, weighted gene coexpression network analysis.

