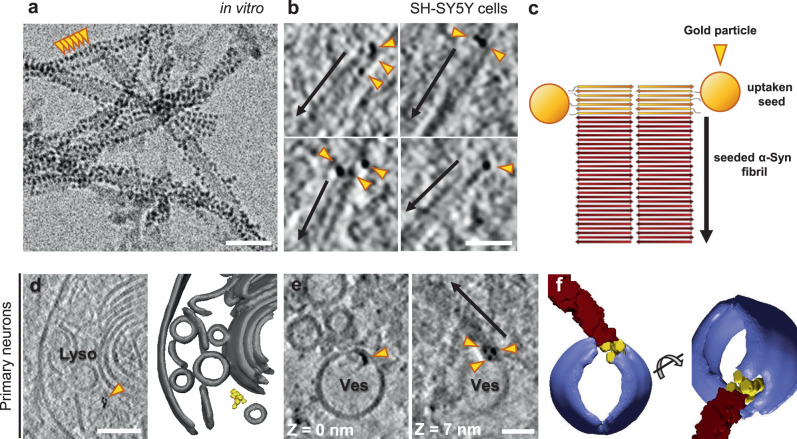
Fig. 3. Seeding of α-Syn aggregates by gold-labeled PFFs.
a Cryo-electron microscopy image of PFFs labeled with 3-nm gold beads (orange arrowheads) via NHS esterification. Scale bar: 30 nm. Three biologically independent experiments were performed. The average distance between gold bead centers was 35 ± 4 Å (mean ± sd). Considering a typical distance between β strands of ~4.8 Å within α-Syn fibrils33,34, this corresponds to labeling every seventh or eighth β-strand on the fibril. b Tomographic slices (thickness 1.8 nm) showing α-Syn fibrils seeded by gold-labeled PFFs within SH-SY5Y cells expressing GFP-α-Syn. Arrows mark the direction of fibril growth from the gold-labeled seed. Scale bar: 40 nm. Two biologically independent experiments were performed. c Schematic of the hypothetical molecular organization of α-Syn fibrils seeded by gold-labeled PFFs. d A tomographic slice (thickness 1.4 nm; left) and 3D rendering of the tomogram (right) showing gold-labeled PFFs within the lumen of a lysosome in a primary neuron expressing GFP-α-Syn. Lyso; lysosome. Lysosomal membranes (gray), gold particles labeling the PFF (yellow). Scale bar: 70 nm. e Tomographic slices (thickness 1.4 nm) at different Z heights showing gold-labeled PFFs found within the membrane of a vesicle (Ves) and seeding an α-Syn fibril (arrow) in a primary neuron expressing GFP-α-Syn. Scale bar: 30 nm. Two biologically independent experiments were performed. f 3D rendering of the tomogram depicted in e in two different orientations. Vesicle membrane (purple), α-Syn fibril (red), gold particles (yellow). Representative images are shown in a, b, d, e, and f.

