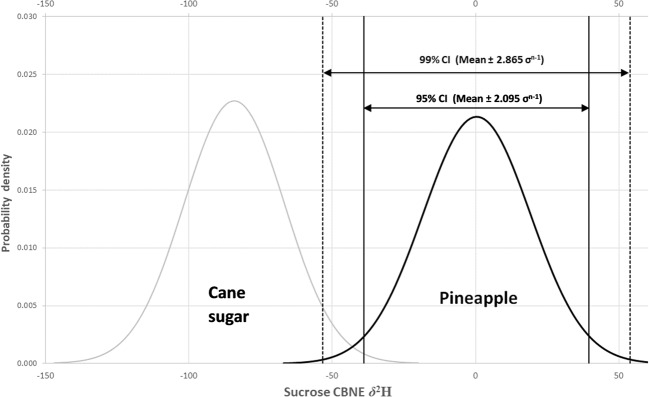
Fig. 2. Gaussian (or normal) distributions created using the NORMDIST function in Microsoft Excel.
The distributions are generated from specified means and standard deviations, for pineapple (black curve) and cane sugar (grey curve) sucrose CBNE δ2H values. The solid and dashed vertical lines show the limits between which 95 and 99% of the authentic pineapple juice population would be expected to fall, respectively. These boundaries are based on the mean and standard deviation of the measured dataset and assume that the measured dataset is representative of the entire pineapple juice population and it follows a normal distribution.

