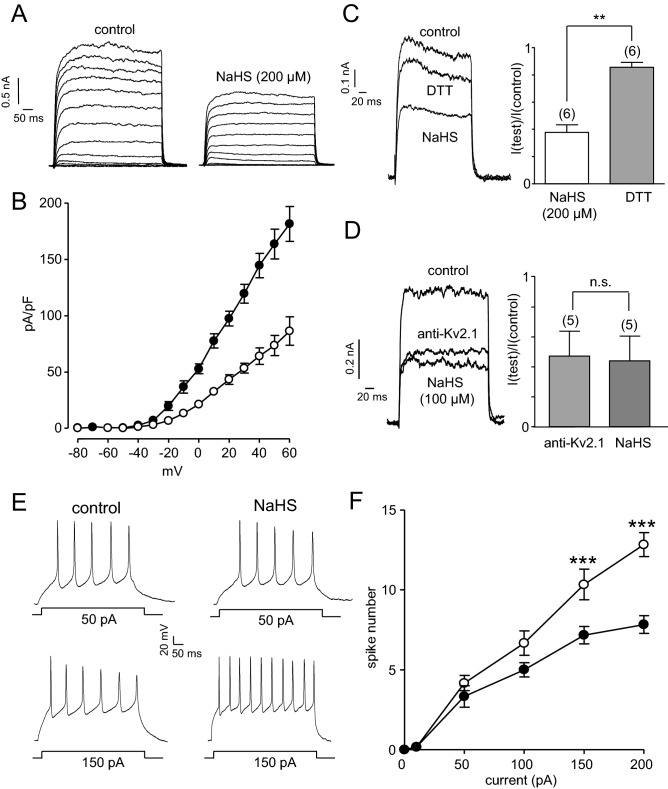
Figure 5.
NaHS inhibits Kv2.1 and augments action potential firing in rat hippocampal neurons. (A) Families of currents evoked in a rat hippocampal neuron before and during exposure to NaHS (200 μM). Currents were evoked by step-depolarizations, applied up to + 60 mV in 10 mV increments from a holding potential of − 70 mV. Scale bars apply to both families of currents. (B) Mean (± s.e.m.) current–density versus voltage relationships obtained in 8 cells before (solid circles) and during (open circles) exposure to NaHS (200 μM). (C) Left, example currents evoked in the same neuron before (control) and during exposure to NaHS (200 μM), then during a subsequent exposure to DTT (1 mM) following washout of NaHS. Right, bar graph showing normalised mean (± s.e.m.) effect of NaHS and recovery of current amplitude by DTT. (**Indicates P < 0.01 with the number of cells tested in parentheses). (D) Left, example currents evoked in the same neuron immediately after obtaining the whole-cell configuration, after 10 min dialysis with an anti-Kv2.1 antibody, and then during a subsequent exposure to NaHS (100 μM), as indicated. Right, bar graph showing normalised mean (± s.e.m.) effect of the anti-Kv2.1 antibody, and the effects of NaHS following a minimum of 10 min dialysis in these cells. (n.s. indicates P > 0.05 with the number of cells employed indicated in parentheses). (E) Example voltage responses evoked by square wave depolarizing current injections (upper traces 50 pA, lower traces 150 pA) in hippocampal neurones perfused in the absence (left hand traces) or presence (right hand traces) of NaHS (200 μM). Scale bars apply to all traces. (F) Mean (± s.e.m.) number of evoked action potentials measured in response to 500 ms depolarizing current injections of varying amplitude. Action potentials were measured in the absence (solid circles) or presence (open circles) of 200 μM NaHS (***indicates P < 0.005, n = 6 for all current steps).

