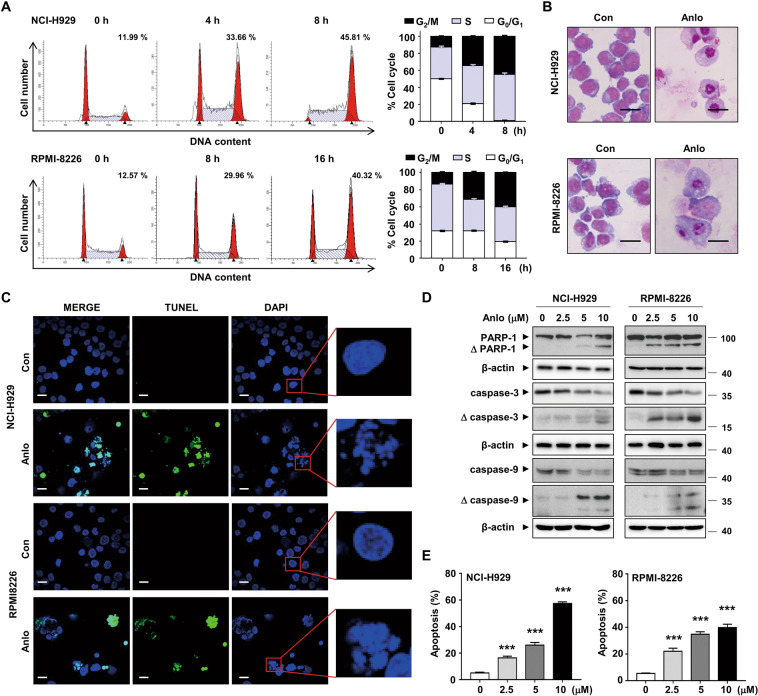
Fig. 3. Anlotinib induces cell cycle arrest and apoptosis in MM cells.
A NCI-H929 and RPMI-8226 cells were treated with 5 µM anlotinib for the indicated time. Cell cycle was analyzed by flow cytometry. The numerical percentage shown indicates the G2/M population. B The morphology of NCI-H929 and RPMI-8226 cells after anlotinib treatment (5 μM, 24 h) was observed by Wright staining. Scale bar: 20 μm. C Representative images of TUNEL and DAPI staining for cells treated with anlotinib (5 μM, 24 h). The green dot represents positive TUNEL staining. The blowup images from the red boxes showed a significant fraction of nuclei after anlotinib exposure. Scale bar: 20 μm. D NCI-H929 and RPMI-8226 cells were treated with anlotinib (0–10 μM) for 24 h. Whole cell lysates were subjected to western blotting using antibodies against PARP-1, caspase 3, caspase 9, and β-actin. E Cells were treated as described in D, and apoptosis was detected by flow cytometry using Annexin V/PI staining. The percentages of apoptotic cells were shown in the histogram from three independent experiments. Each experiment was performed in triplicate. Con: control group; Anlo: anlotinib group. ***P < 0.001.

