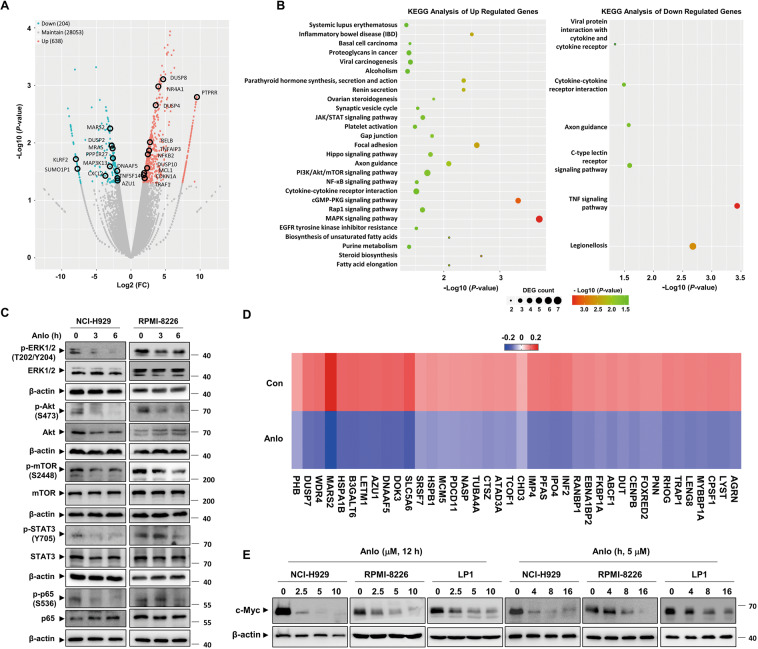
Fig. 4. Genome-wide transcriptome analysis of anlotinib-treated MM cells.
A Volcano plot of the DEGs from the transcriptomes of the control and anlotinib group (P < 0.05, Fold change > 1.5). B KEGG analysis of the DEGs. C NCI-H929 and RPMI-8226 cells were treated with anlotinib (5 μM) for the indicated time. Whole cell lysates were subjected to western blotting. D Heatmaps of the top 40 downregulated c-Myc target genes in NCI-H929 cells treated with anlotinib versus DMSO for 12 h. Rows show Z-scores are calculated for each cell type. E NCI-H929, RPMI-8226, and LP1 cells were treated with the indicated concentration of anlotinib for 24 h or 5 μM anlotinib for the indicated time. Whole cell lysates were subjected to western blotting using c-Myc and β-actin antibodies. Con control group, Anlo anlotinib group. The experiments were performed in triplicate.

