Figure 4.
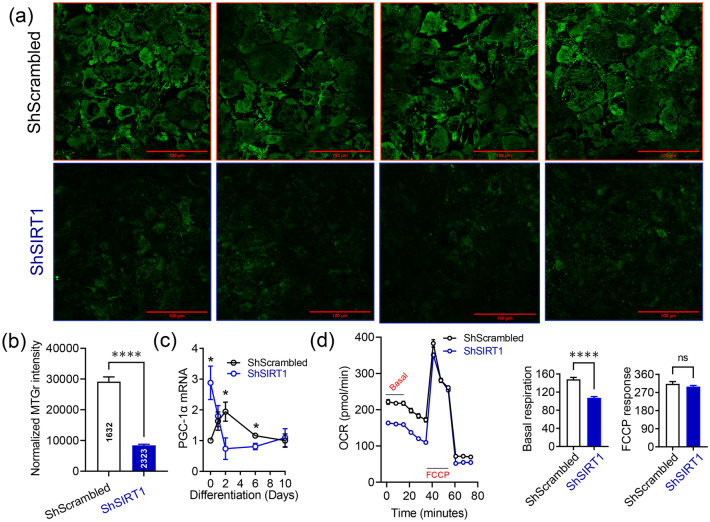
SIRT1 promoted mitochondrial biogenesis and respiration in 3T3-L1 adipocytes. (a) Representative confocal microscopy images of ShScrambled or SIRT1-depleted (ShSIRT1) adipocytes labelled with 250 nM MitoTracker Green at Day 6 post-differentiation. Scale bar 100 µm. (b) Quantification of MitoTracker Green staining intensity in ShScrambled or SIRT1-depleted (ShSIRT1) adipocytes (normalized to cell number) (n = 3). (c) Quantification of changes in the expression of PGC-1α in ShScrambled or SIRT1-depleted (ShSIRT1) (pre)adipocytes at specific time-points during adipogenesis (n = 4). (d) Evaluation of mitochondrial respiration parameters in ShScrambled or SIRT1-depleted (ShSIRT1) adipocytes using Seahorse technology at Day 6 post-differentiation (n = 12 biological replicates). Statistical analysis of the dataset was performed using a Student’s t test. For statistical analysis of data shown in (c), pair-wise comparisons were made between ShScrambled and ShSIRT1 groups for each individual time-point using the Student’s t test (*P < 0.05; ****P < 0.0001; n.s., not significant).

