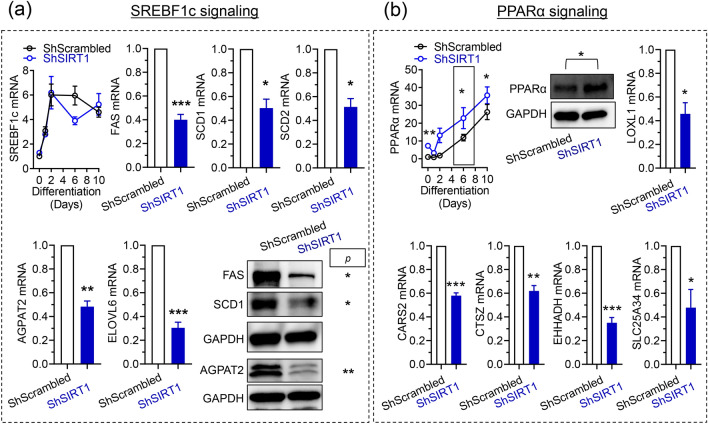
Figure 6.
SIRT1-dependence of SREBF1c and PPARα signaling in 3T3-L1 adipocytes. (a) Quantitative analysis of the expression levels of SREBF1c and its downstream transcriptional targets in ShScrambled or SIRT1-depleted (ShSIRT1) adipocytes at Day 6 post-differentiation. (b) Quantitative analysis of the expression levels of PPARα and its downstream transcriptional targets in ShScrambled or SIRT1-depleted (ShSIRT1) adipocytes at Day 6 post-differentiation. Boxed region indicates the time-point at which PPARα protein levels were quantified. In (a,b), qPCR and western blot data were from 4 and 3 independent experiments, respectively. Statistical analysis of the dataset was performed using a Student’s t test (*P < 0.05; ****P < 0.0001; n.s. not significant).

