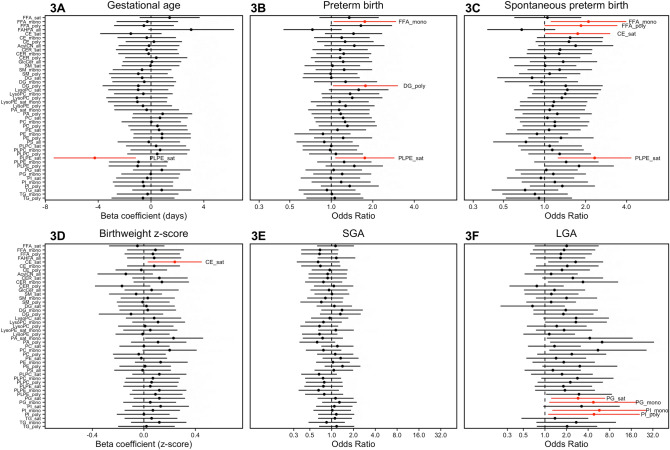
Figure 3.
Forest plots of effect estimates of associations between hydrocarbon chain subgroups of lipid classes and pregnancy outcomes: (A) gestational age at delivery; (B) preterm birth (ncases = 31,ncontrols = 69); (C) spontaneous preterm birth (ncases = 19,ncontrols = 69); (D) birthweight z-score; (E) small for gestational age [SGA] (ncases = 16,ncontrols = 75); (F) large for gestational age [LGA] (ncases = 9,ncontrols = 75). Models adjusting for maternal age, maternal education, fetal sex, pre-pregnancy BMI, and weight gain. Associations highlighted in red have p-values < 0.05, but all associations had corresponding q-values exceeding 0.2.

