Figure 3.
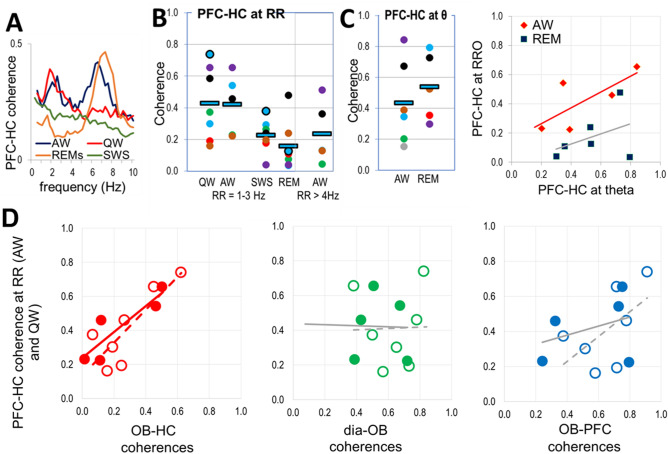
Coupling of PFC and HC networks by RRO. (A) PFC-HC coherences at the respiratory frequency (RRO) in different states. (B) PFC-HC coherences at RRO in awake (QW, AW) and sleep states (SWS, REM) at RRO (1–3 Hz). Squares: group averages, dots: individual experiments; same colors were used for individual rats in different states (same colors as in Fig. 2A). (C) Distribution of PFC-HC coherences at theta (6–8 Hz) frequency and it’s relationship to RRO coherences in theta states. (D) Correlation between RRO coherences connecting PFC and HC vs. RRO coherences connecting OB to HC, dia, and PFC signals in AW (filled symbols and solid trendlines) and QW (open symbols and dashed trendlines) recordings at RRO frequency. Significant correlations are shown in the color of the corresponding dots, and trendlines of nonsignificant correlations are shown in gray.

