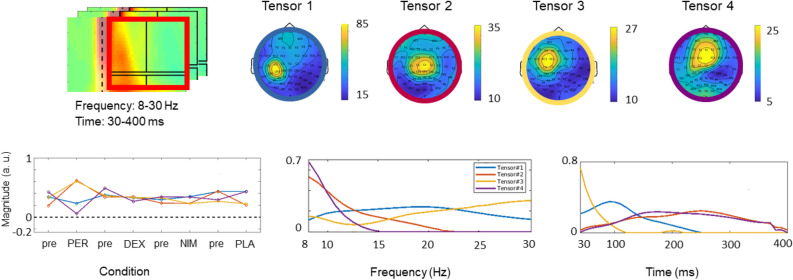
Figure 6.
PARAFAC tensor decomposition of TMS-induced EEG oscillations (TIOs). Top row shows in the red square the time–frequency representation window employed for tensor decomposition analysis (the black lines denote the time–frequency intervals of the standard TIO analysis), and the topographies of the four tensor components (TCs) obtained from the induced data circled with four colors: blue, red, yellow and violet. The four TCs we obtained by extracting the most relevant components out of a 5D tensor with dimensions: Subject, Space, Drug Condition, Frequency, and Time. Bottom row, left plot: Drug-induced changes of the four tensors comparing pre- and post-drug data (PER, perampanel; DEX, dextromethorphan; NIM, nimodipine; PLA, placebo; the same colors as in top row indicate the different tensor components). Central plot: tensor frequency contents. Right plot: tensor time courses (time after the TMS pulse, in ms). Figure generated with MATLAB R2016a (https://www.mathworks.com) and the Fieldtrip Matlab toolbox (http://www.fieldtriptoolbox.org).

