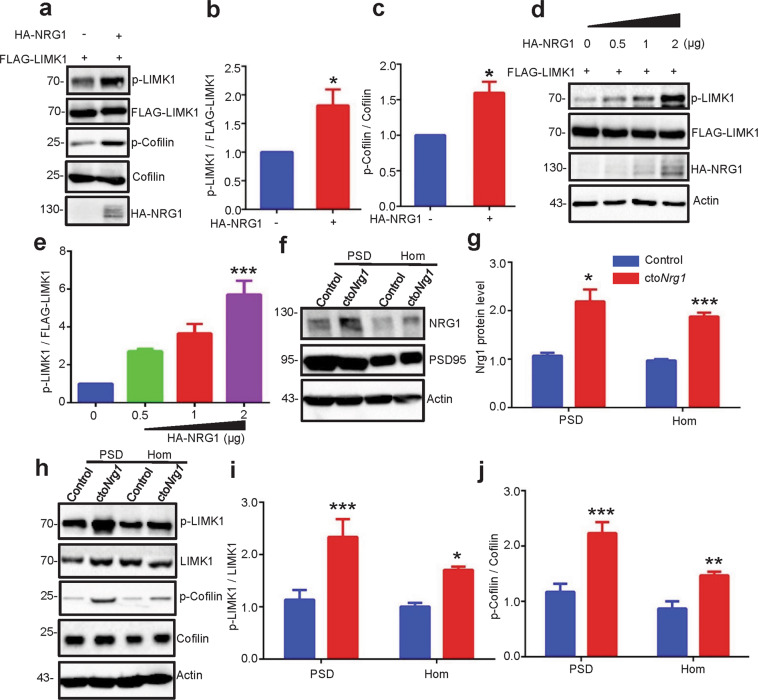
Fig. 3. Activation of LIMK1 by NRG1 overexpression.
a–c NRG1 overexpression increased phosphorylations of LIMK1 and its downstream Cofilin in HEK293 cells. HEK293 cells were co-transfected with FLAG-LIMK1 and 1.5 µg HA-NRG1 or HA empty vector and subjected to WB with indicated antibodies (a). The relative intensities of phosphorylated LIMK1 (p-LIMK1, Thr505) to FLAG-LIMK1 (b) and of phosphorylated Cofilin (p-Cofilin, Ser3) to Cofilin (c) from three independent experiments were quantified (p = 0.0432 for p-LIMK1; p = 0.0185 for p-Cofilin). Data were shown as mean ± SEM. *p < 0.05, Student’s t-test. d, e NRG1 overexpression increased LIMK1 phosphorylation in a dose-dependent manner. FLAG-LIMK1 were co-transfected with different amounts of HA-NRG1 in gradient into HEK293 cells for WB with indicated antibodies. Actin served as a loading control (d). Quantitative analysis of relative p-LIMK1 levels in d (p < 0.001 for 0.5, 1, 2 µg in p-LIMK1) (e). Data were from three independent experiments and shown as mean ± SEM. ***p < 0.001, one-way ANOVA. f, g NRG1 level was increased in the PSDs of ctoNrg1 mice. Aliquots of whole brain homogenates (Hom. Whole-cell lysates) and PSD fractions from cto Nrg1 and control mice were probed for NRG1, PSD95 (a PSD marker) and actin (f). Quantitative analysis of NRG1 levels in f (g). h–j Phosphorylations of LIMK1 and Cofilin were increased in PSD of ctoNrg1 mice. Representative images of WB with indicated antibodies (h). Quantitative analysis of relative p-LIMK1 (i) and p-Cofilin (j) levels in h. N = 9 mice for each genotype (p = 0.004 in Hom, p = 0.0111 in PSD for NRG1 level in g; p = 0.0176 in Hom, p = 0.004 in PSD for p-LIMK1 in i; p = 0.0088 in Hom, p = 0.0005 in PSD for p-Cofilin in j). Data were shown as mean ± SEM. *p < 0.05, **p < 0.01, and ***p < 0.001, Student’s t-test.

