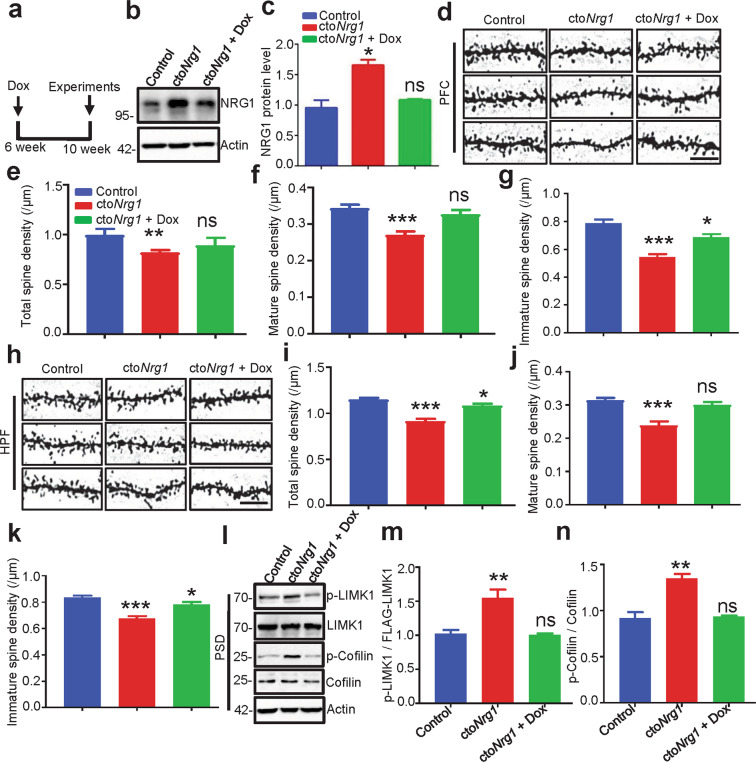
Fig. 6. Rescued spine deficiency in ctoNrg1 mice by restoring NRG1 level.
a Schematic schedule of Dox treatment. Male 6-week ctoNrg1 mice were treated with Dox or water for 4 weeks and subjected to WB and Golgi staining. b, c Increased NRG1 level in the forebrain of ctoNrg1 mice was restored after Dox treatment. Forebrain lysates from ctoNrg1, ctoNrg1 treated with Dox or control mice were probed with anti-NRG1 antibody. Quantification of NRG1 level (c), N = 3 mice for each group (p = 0.0101 for ctoNrg1, p = 0.363 for ctoNrg1 + Dox). Data were shown as mean ± SEM. *p < 0.05, one-way ANOVA. d–k Reduced spine densities in PFC (d–g) and HPF (h–k) of ctoNrg1 mice were rescued after Dox treatment. Representative Golgi staining images for spine densities in control, ctoNrg1, and ctoNrg1 + dox mice. Scale bar, 10 μm (d and h). Quantitative analysis of total (e and i), mature (f and j) and immature (g and k) spine densities in d and h. N = 3 mice for each group (In PFC: p < 0.001 for ctoNrg1 and p = 0.2265 for ctoNrg1 + Dox for total spine, p < 0.001 for ctoNrg1 and p = 0.5548 for ctoNrg1 + Dox for mature spine, p < 0.0001 for ctoNrg1 and p = 0.013 for ctoNrg1 + Dox for immature spine; in HPF: p < 0.001 for ctoNrg1 and p = 0.0182 for ctoNrg1 + Dox for total spine, p < 0.001 for ctoNrg1 and p = 0.2532 for ctoNrg1 + Dox for mature spine, p < 0.0001 for ctoNrg1 and p = 0.0259 for ctoNrg1 + Dox for immature spine). Data were shown as mean ± SEM. *p < 0.05, **p < 0.01, and ***p < 0.001, one-way ANOVA. l–n LIMK1 and Cofilin phosphorylation in PSDs of ctoNrg1 were restored after Dox treatment. PSD fractions of control, ctoNrg1, and ctoNrg1 + Dox mice were probed with indicated with antibodies (l). Quantitative analysis of relative levels of p-LIMK1 and p-Cofilin in l (m, n). N = 5 mice for each group (p = 0.0087 for ctoNrg1, p = 0.7758 for ctoNrg1 + Dox in p-LIMK1; p = 0.0019 for ctoNrg1, p = 08239 for ctoNrg1 + Dox in p-Cofilin). Data were shown as mean ± SEM. **p < 0.01 and ns, p > 0.5. one-way ANOVA.

