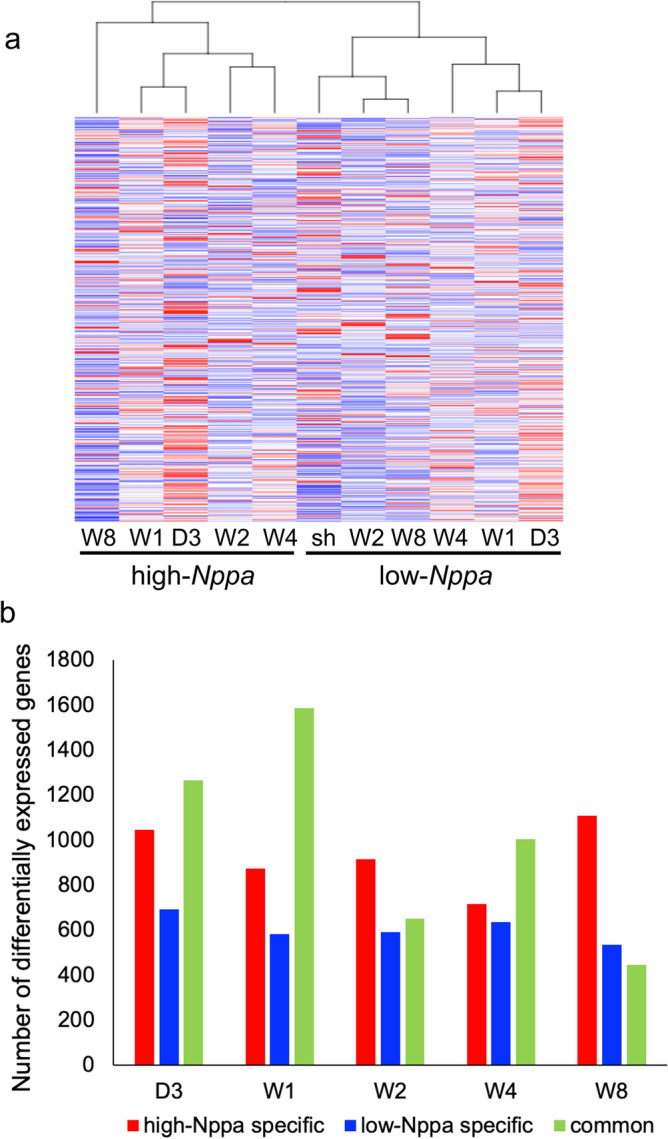
Figure 5.

The difference of gene expression patterns in cardiomyocytes with high and low Nppa expression. (a) Hierarchical clustering of both genes and samples based on their gene expression profiles in the gene expression matrix. Cardiomyocytes were divided into two subgroups based on Nppa expression level; high-Nppa group and low-Nppa group. The average gene expression levels were calculated for samples from each time point in the high-Nppa group and low-Nppa group. (b) Bar graph shows the number of DEGs detected in high-Nppa, low-Nppa and common group, compared with sham group. “Common genes” indicate DEGs present in both high-Nppa expressing cardiomyocytes and low-Nppa expressing cardiomyocytes.
