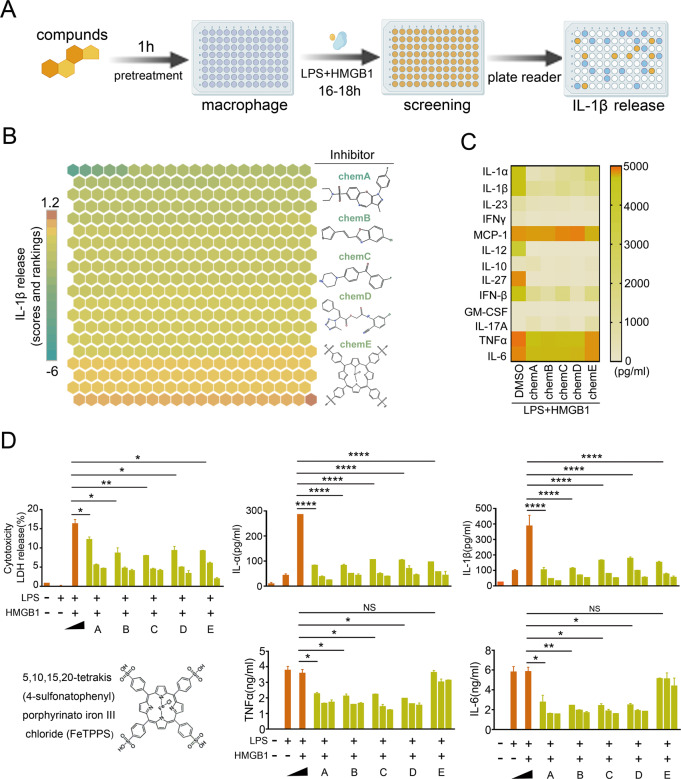
Fig. 1. Identification of bioactive compounds inhibits the HMGB1-caspase-11 pathway.
A A phenotypic screening strategy to identify compounds that inhibit the HMGB1-caspase-11 pathway in mouse macrophages exposed to both recombinant HMGB1 and LPS. B Heatmap of HMGB1-caspase-11 pathway activity changes based on IL-1β release from mouse peritoneal macrophages after stimulation with LPS (1 μg/mL) + HMGB1 (400 ng/mL) for 16 h in the absence or presence of 434 bioactive compounds (10 μM). C Heatmap of cytokine assay in mouse macrophages after stimulation with LPS (1 μg/mL) + HMGB1 400 ng/mL 16 h in the absence or presence of five small molecules. D LDH Assay and ELISA for IL-1α, IL-1β, TNFα, and IL-6 in the supernatants of mouse peritoneal macrophages after stimulation with LPS (1 μg/mL) + HMGB1 (400 ng/mL) for 16 h in the absence or presence of five small molecules with indicated dose (1, 5, and 10 μM). Graphs show the mean ± SD of technical replicates and are representative of at least three independent experiments. An unpaired t-test (two-sided) was used (LDH LH vs. LH + A *P = 0.0494; LH vs. LH + B *P = 0.0266; LH vs. LH + C **P = 0.0095; LH vs. LH + D P = 0.0252; LH vs. LH + E *P = 0.0133; IL-1α, IL-1β LH vs. LH + A/B/C/D/E ****P < 0.0001; TNFα LH vs. LH + A *P = 0.0198; LH vs. LH + B *P = 0.0185; LH vs. LH + C *P = 0.0169; LH vs. LH + D P = 0.0119; IL-6 LH vs. LH + A *P = 0.0355; LH vs. LH + B **P = 0.0088; LH vs. LH + C *P = 0.0103; LH vs. LH + D P = 0.0101). Compound A: N,N-dimethyl-3-{[(2-methylquinazolin-4-yl)sul-fanyl]methylbenzene-1-sulfonamide; Compound B: 5-chloro-2-[2-(thiophen-3-yl)ethe-nyl]-1,3-benzoxazole; Compound C: (5E)-5-{[5-(4-Chlorophenyl)-2-furyl]methylene}-2thioxoimidazolidin-4 4-one; Compoud D: 2-oxo-2-(3-oxo-1,2,3,4-tetrahydroquinoxalin-1-yl) ethyl 2-[(4,4,4- trifluoro-3-oxobut-1-en-1-yl) amino] benzoate; Compound E: 5,10,15,20-Tetrakis(4-sulfonatophenyl) porphyrinato Iron (III), chloride.

