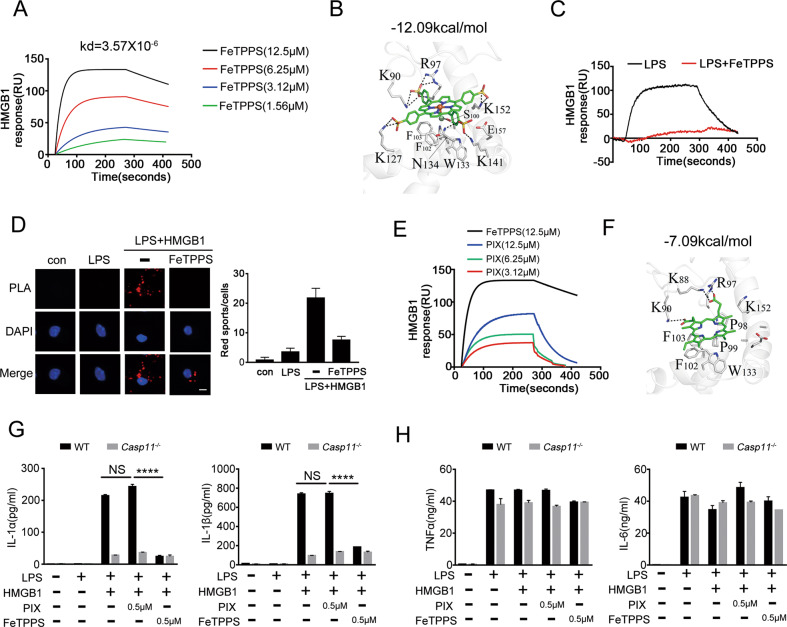
Fig. 5. FeTPPS disrupts the HMGB1-LPS binding.
A The sensorgrams of FeTPPS (1.56, 3.12, 6.25, 12.5 μM) binding to the HMGB1 chip-immobilized proteins are expressed in RU (response unit) vs. time after subtracting the control signal. B The 3D binding model between FeTPPS and HMGB1. The protein is shown as cartoon, the compound is colored in green. High-scoring docking poses of FeTPPS and HMGB1 was −12.09 kcal/mol. Ionic bonds are shown as dash lines. C The sensorgrams of LPS binding to the HMGB1 chip-immobilized proteins with or without FeTPPS are expressed in RU (response unit) vs. time after subtracting the control signal. D Interaction between HMGB1 and LPS was visualized as red spots under fluorescence microscopy using the proximity-ligation assay (PLA). Mouse peritoneal macrophages stimulated with LPS alone (5 μg/mL) or LPS (5 μg/mL) + HMGB1 (10 μg/mL) (LH) in the absence or presence of FeTPPS (1 μM) for 2 h. Scale bar: 10 μm. E The binding affinity of FeTPPS or Protoporphyrin IX (PIX) with recombinant HMGB1 (immobilized) are expressed in RU (response unit) vs. time after subtracting the control signal. F The 3D binding model between PIX and HMGB1. The protein is shown as cartoon, the compound is colored in green. High-scoring docking poses of PIX and HMGB1 was −7.09 kcal/mol. Ionic bonds are shown as dash lines. G, H Production of IL-1α, IL-1β, TNFα and IL-6 (as measured by ELISA) from WT or Casp11−/− peritoneal macrophages stimulated with LPS (1 μg/mL) + HMGB1 (400 ng/mL) in the absence or presence of PIX or FeTPPS for 16 h. Data presented as mean ± SD of technical replicates. An unpaired t-test (two-sided) was used. ****P < 0.0001. Graphs are representative of at least three independent experiments.

