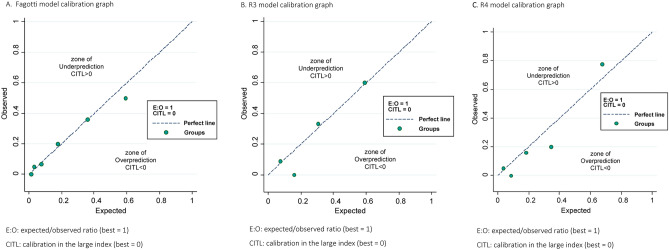
Figure 1.
Calibration plots for suboptimal cytoreduction by probability groups (A) Fagotti model calibration graph. E:O: expected/observed ratio (best = 1), CITL: calibration in the large index (best = 0). (B) R3 model calibration graph. E:O: expected/observed ratio (best = 1). CITL: calibration in the large index (best = 0). (C) R4 model calibration graph. E:O: expected/observed ratio (best = 1). CITL: calibration in the large index (best = 0).

