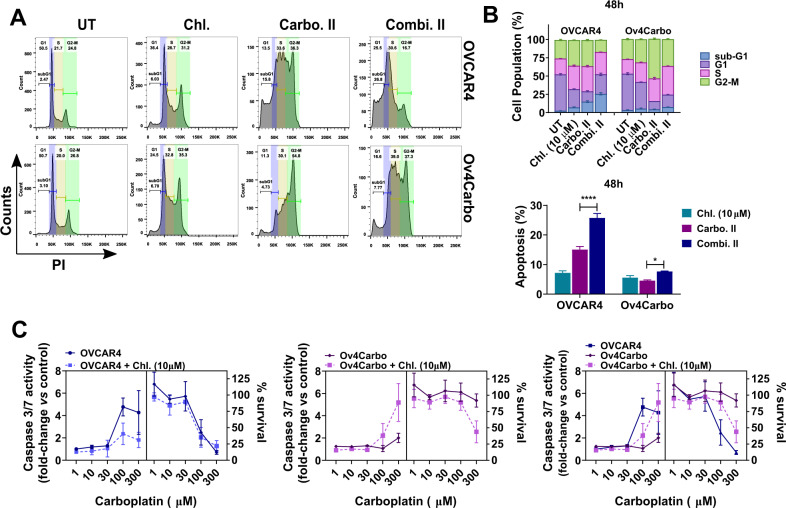
Fig. 7. Analysis of cell cycle profile and cell death in OVCAR4 (sensitive) and Ov4Carbo (resistant) ovarian cancer cells.
A Representative histograms 48 h post treatment; B cell cycle distribution (top) and percentage of sub/G1 apoptotic cells (bottom); C analysis of caspase 3/7 activity vs. cell survival in OVCAR4 (left panel), Ov4Carbo (middle panel) and summary of assay (right panel). Cells were treated with chloroxine (10 μM), carbo II (100 μM) or combi. II (chloroxine 10 μM + carboplatin 100 μM). Untreated cells were used as control. Data show mean ± s.d., and percentage of G1 (2n), S and G2/M (4n) fraction population (FACs: n = 2; caspase 3/7: n = 3 biological repeats). Unpaired t test, ****P < 0.0001, *P < 0.05 (compared to carboplatin treated).

