Figure 2.
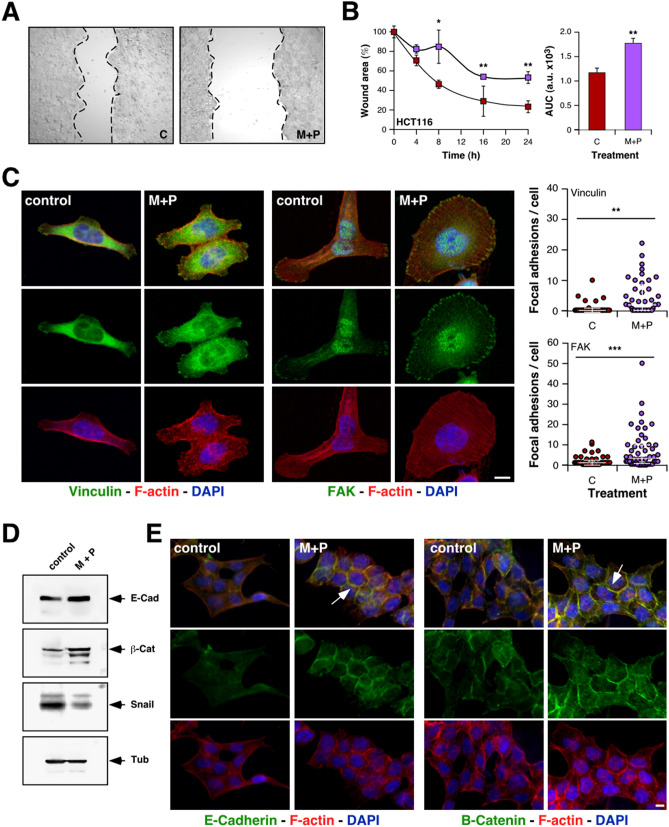
Combination of M + P affects EMT in CRC cells. (A,B) The migratory ability of HCT116 cells was estimated by measuring closure of the initial wound. Pictures were taken (A) to allow quantification of healing (B) by using the Image J software (AUC, area under the curve). (C) Focal adhesions were highlighted by Immunofluorescent detection of vinculin (green color, left panel) and FAK (green color, middle panel) in HCT116 cells counterstained with F-actin and nuclei (red and blue colors respectively, scale bar = 10 µm) and quantified (right panel). (D) Representative immunoblots showing modulation of EMT markers expression by M + P treatment. For loading control, we used the abundance of endogenous tubulin (n = 3 independent experiments). (E) Representative immunofluorescence analysis showing the abundance and subcellular localization of endogenous E-cadherin (green color, left panel), β-catenin (green color, right panel), rhodamine phalloidin-stained F-actin (red color), and DAPI-stained nuclei (blue color). Arrows indicate increased detection at cellular junctions (scale bar = 10 µm).

