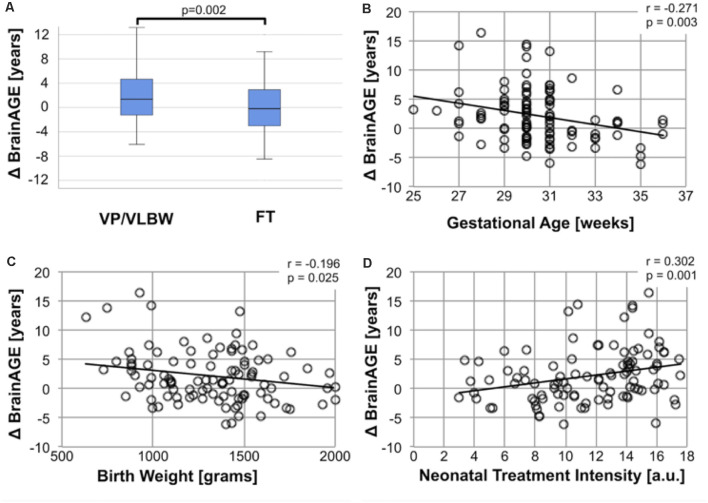
Figure 1.
Increased BrainAGE after premature birth. (A) Group difference of BrainAGE between VP/VLBW and FT controls. Box plots of individual BrainAGE scores are shown for VP/VLBW and FT adults, indicating the median, interquartile range, and range. The median BrainAGE score is significantly elevated in VP/VLBW adults compared to FT controls as determined by Mann-Whitney U-test [VP/VLBW: 1.37 years, interquartile range (IQR): −1.26–4.67 years vs. FT: −0.19, IQR: −3.02–3.28 years; p = 0.002]. Increased BrainAGE is associated with perinatal variables of premature birth (B–D). (B) ΔBrainAGE (y-axis) is plotted against gestational age (GA) at birth in weeks (x-axis) in VP/VLBW individuals. A linear regression line is added. Spearman’s r revealed a significant correlation (r = −0.271, p = 0.003). (C) ΔBrainAGE (y-axis) is plotted against birth weight (BW) in grams (x-axis) in VP/VLBW individuals. A linear regression line is added. Spearman’s r revealed a significant correlation (r = −0.196, p = 0.025). (D) Association between BrainAGE and neonatal treatment intensity. ΔBrainAGE (y-axis) is plotted against neonatal treatment intensity as measured by INTI (index of neonatal treatment intensity; x-axis) in VP/VLBW individuals. A linear regression line is added. Spearman’s r revealed a significant correlation (r = −0.302, p = 0.001). Abbreviations: BrainAGE, Brain Age Gap Estimate; FT, full-term; IQR, interquartile range; VP/VLBW, very preterm and/or very low birth weight.

