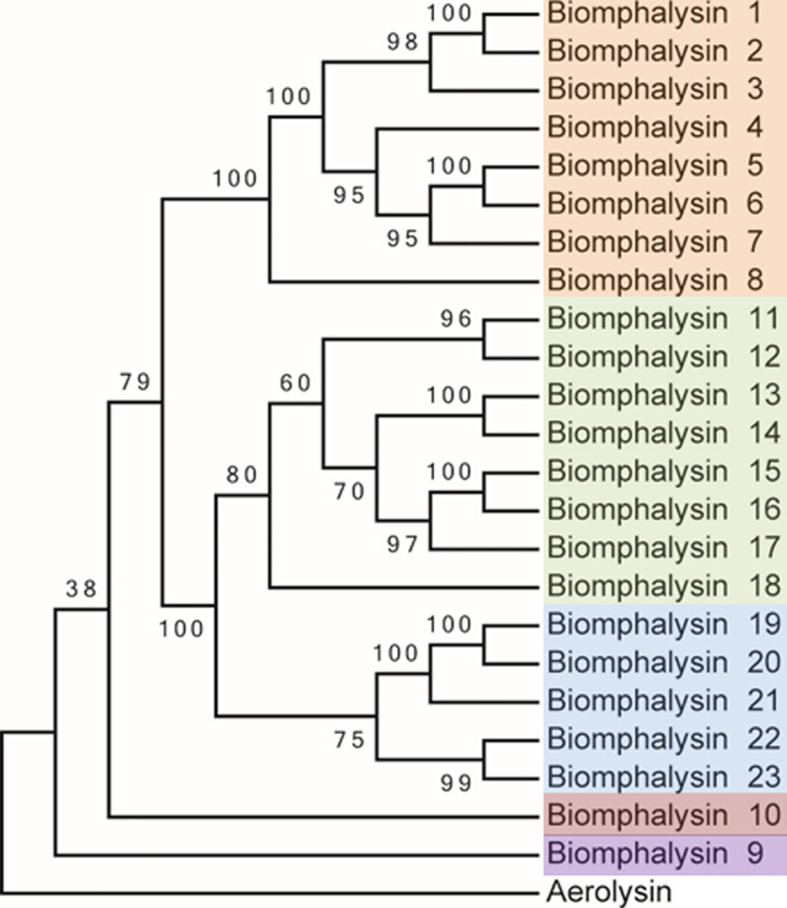
Figure 1.
Phylogenetic analysis of the protein sequences from the 23 biomphalysins from Biomphalaria glabrata. The three clusters identified in this analysis are highlighted in orange, green and blue for the clusters I, II and III that contain biomphalysins 1 to 8, 11 to 18 and 19 to 23, respectively. Biomphalysin 9 in purple and 10 in red do not group within biomphalysin clusters. The aerolysin sequence from Aeromonas hydrophila (GenBank P09167) was used as an outgroup. aLRT was carried out on the tree inferred from the Maximum Likelihood method. Ratio test values multiplied by 100 are shown at each branch of the trees. The accession number of each gene and protein used is listed in Table S1.

