
Figure 5.
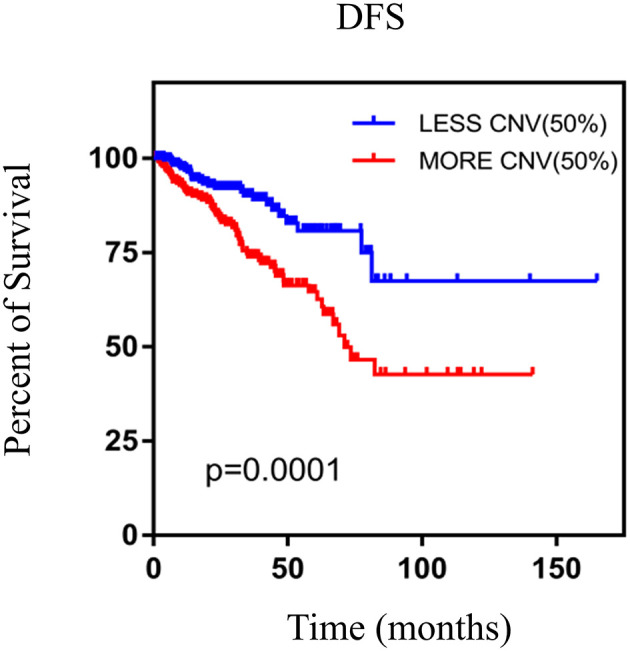
The Kaplan–Meier survival analysis of nine genes. p < 0.05 was considered statistically different. DFS, disease-free survival; CNV, copy number variation.
Official websites use .gov
A
.gov website belongs to an official
government organization in the United States.
Secure .gov websites use HTTPS
A lock (
) or https:// means you've safely
connected to the .gov website. Share sensitive
information only on official, secure websites.
The Kaplan–Meier survival analysis of nine genes. p < 0.05 was considered statistically different. DFS, disease-free survival; CNV, copy number variation.