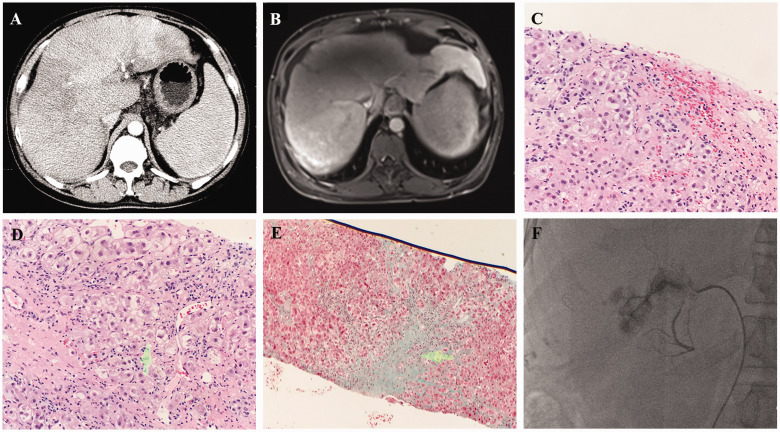
Figure 1.
Diagnosis of hepatic sinusoidal obstruction syndrome. (a) Enhanced abdominal computed tomography revealed hepatosplenomegaly, an uneven density, and diffuse patchy shadows in the whole hepatic lobe. (b) Enhanced magnetic resonance imaging revealed heterogeneous hepatic enhancement and significant stenosis in hepatic veins. (c) Hematoxylin–eosin staining of liver tissues revealed congestive liver (×10). (d) An image of Mallory’s corpuscles (arrow, ×10). (e) Masson’s staining revealed fibrinogen thickening of sublobular venules (×4). (f) Digital subtraction angiography disclosed narrowing at the initial part of the left hepatic vein and proximal stenosis of accessory hepatic vein with collateral circulation formation.

