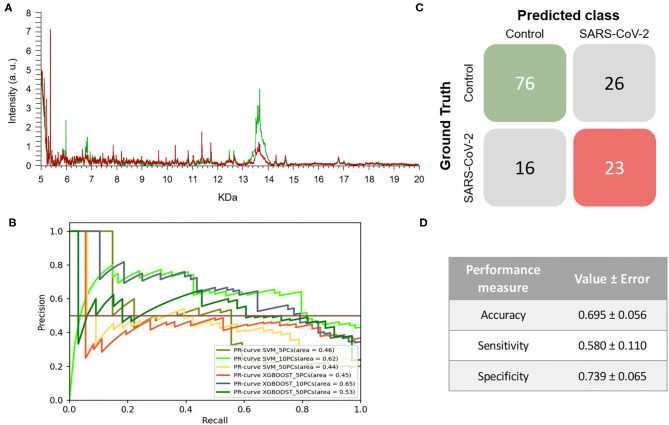
Figure 1.
Results of the first experiment. (A) Representative mass spectra of NP samples for SARS-CoV-2: positive (red) and negative (green). (B) Precision-recall curve from the different models. (C) Average confusion matrix and (D) average performance metrics including the standard deviation (note that the test was performed 20 times selecting random different samples for each iteration) of the best model (SVM + 10PCs cross-validation K = 10).

