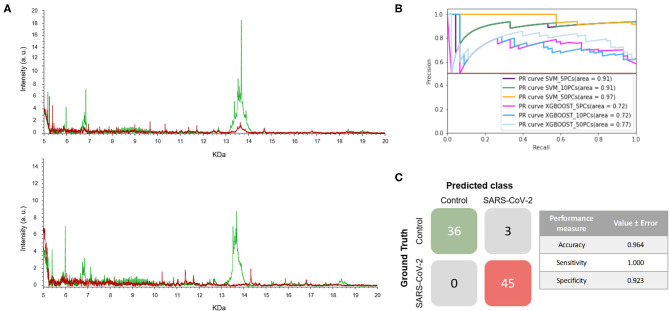
Figure 5.
Developed methodology robustness. (A) Representative mass spectra of NP samples [positive (red) and negative (green)] for SARS-CoV-2 of S1 (top mass spectra) and S2 (down mass spectra). (B) Precision-recall curve from the different models. (C) Matrix confusion showing the summary of the results of all the samples used in the test phases and performance measures of the best model (SVM + 5PCs cross-validation K = 10). Note that no errors are included given that the results correspond to a single test set.

