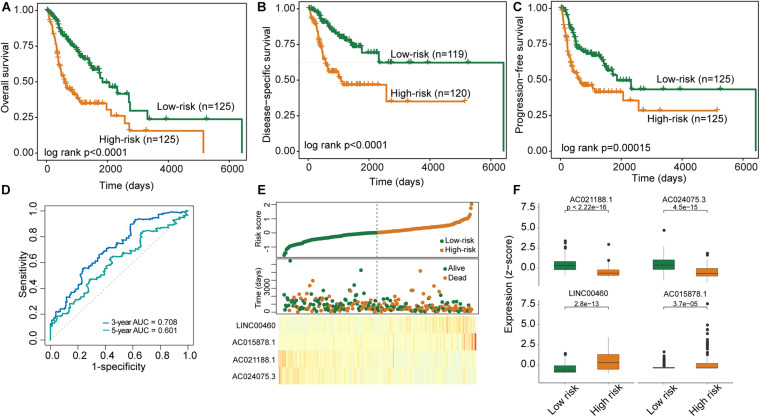
FIGURE 2.
Performance evaluation of the DNAMeFourLncSig in the discovery cohort. (A–C) Kaplan-Meier survival curves of survival between low-risk and high-risk groups. (D) ROC analysis of the DNAMeFourLncSig at 3- and 5-years. (E) The distribution of DNAMeFourLncSig risk score, survival status and expression heatmap of patients. (F) Boxplots for expression levels of four lncRNA biomarkers between low-risk and high-risk groups.

