
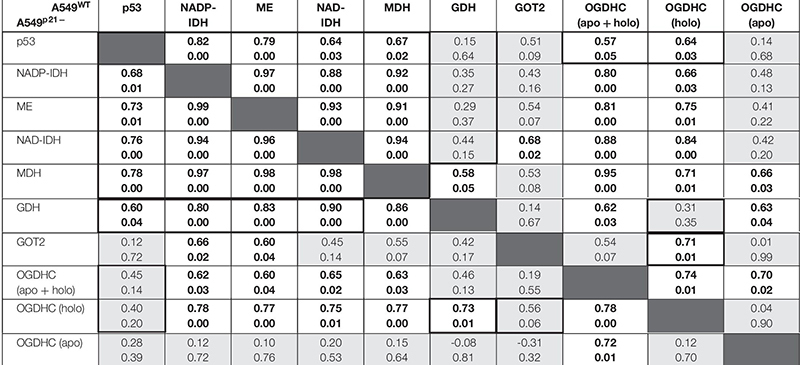
TABLE 1.
Correlations between the levels of p53 and studied enzymes in A549WT (top right corner) and A549p21– (bottom left corner) cell lines at varied thiamine/ThDP levels.
|
Each cell of the table shows the corresponding Pearson correlation coefficients (above) and P-values (below). The data in bold depict significant correlations (p < 0.05), the cells in light-gray correspond to non-significant correlations (p > 0.05). The framed parts show the permanent and variable parts of the correlations in the two cell types. All data successfully passed the D’Agostino and Pearson omnibus normality test.