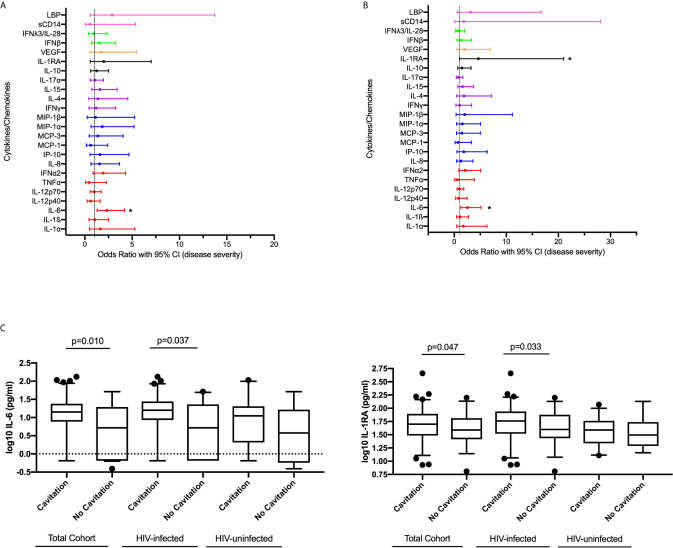
Figure 3.
Association between cytokine/chemokine expression measured at active TB and disease severity measured by lung cavitation (n=132) in both (A) univariable and (B) multivariable model. Individual associations are shown between 8-week culture conversion and pro-inflammatory cytokines (red), chemokines (blue), adaptive response cytokines (purple), anti-inflammatory (black), growth factors (orange), interferons (green) and plasma biomarkers (pink) with error bars depicting 95% confidence intervals. The dotted line at 1 is the interpretation of odds ratio. Asterisk in (A, B) indicates significant associations (p < 0.05). (C) IL-6 and IL-1RA plasma levels associated with cavitary versus non-cavitary disease in total cohort (Cavitation n=93, no cavitation n=39), HIV-infected participants (Cavitation n=63, no cavitation n=33) and HIV-uninfected individuals (Cavitation n=30, no cavitation n=6). Cytokines were plotted on log scale (Log 10), Box and Whiskers (5–95%). p-values shown on the graph (C) are the results of the multivariable logistic regression.

