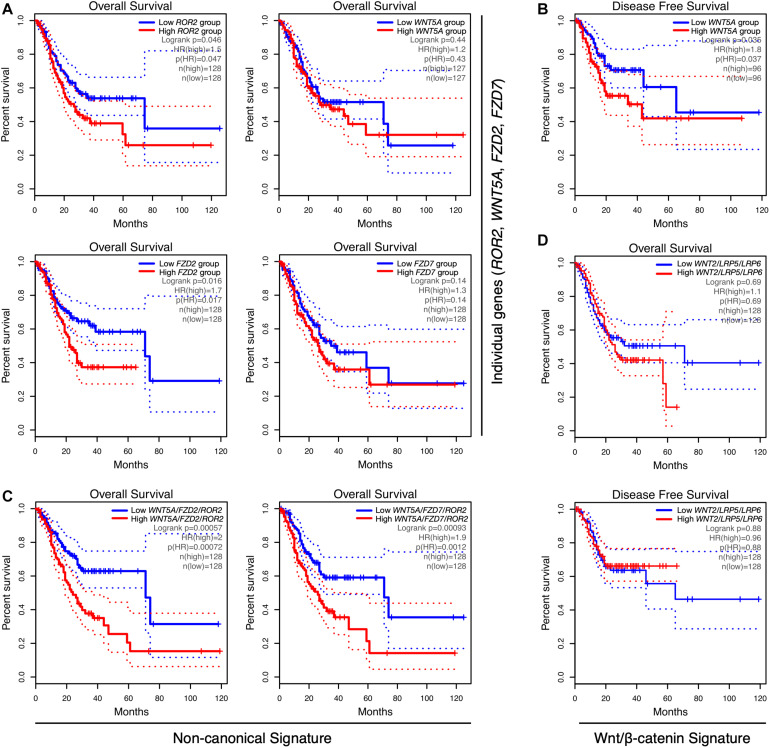
FIGURE 2.
Correlation between gene expression and overall survival in GC. (A) Correlation between ROR2, WNT5A, FZD2, and FZD7 gene expression and overall survival (OS), using terciles, in GEPIA. (B) Correlation between low and high WNT5A expression and disease-free survival (RFS), using quartiles. (C) Correlation between the WNT5A/FZD2/ROR2 (left) and WNT5A/FZD7/ROR2 (right) gene signatures and OS, using GEPIA. (D) Correlation between the Wnt/β-catenin gene signature WNT2/LRP5/LRP6, and OS (top) or RFS (bottom), by using terciles. The number of samples per condition, denoted as n(high) (red lines) and n(low) (blue lines), as well as the HR and Log-rank p-values, are indicated in each plot. Dotted lines show the 95% confidence interval (CI).

