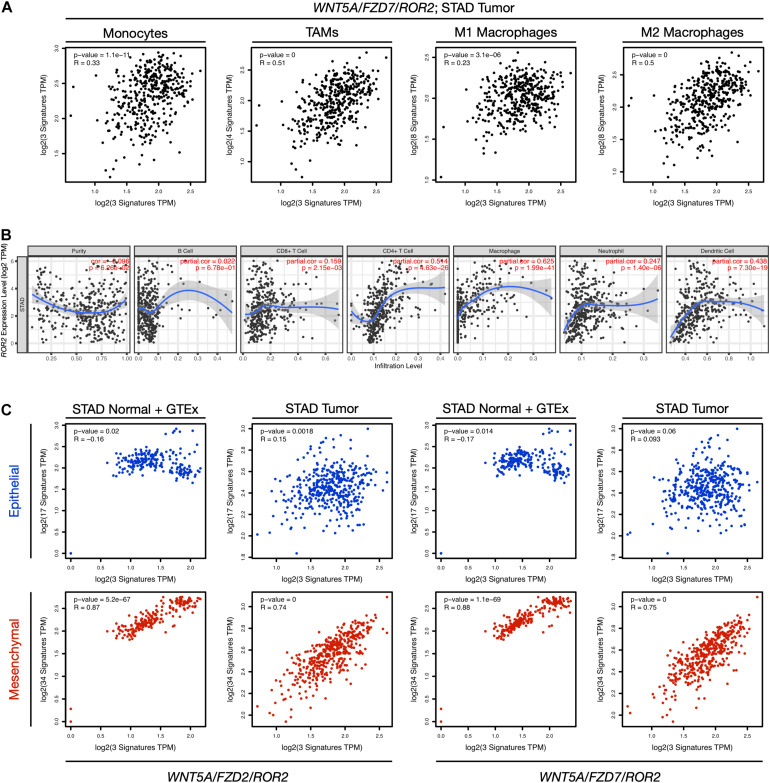
FIGURE 3.
Correlation between gene expression, immune cell markers, and EMT. (A) The correlation between the WNT5A/FZD7/ROR2 signature and signatures of monocytes, tumor-associated macrophages (TAMs), M1 macrophages, and M2 macrophages for the STAD Tumor dataset was evaluated using the “Gene Signature” comparison option in GEPIA (Correlation Analysis). The Spearman correlation coefficients and p-values are indicated in each plot. The markers used for the analysis are listed in Supplementary Table 1, and a full comparison including all Wnt signatures and both “STAD Normal + GTEx data” and “STAD Tumor data” is presented in Supplementary Table 3. (B) Correlation between ROR2 gene expression and immune cell infiltration. The analysis was performed using TIMER, adjusting by tumor purity. See Supplementary Figure 4 for a panel including WNT5A, FZD2, and FZD7. (C) Correlation between the indicated non-canonical Wnt signatures and gene signatures corresponding to an epithelial (blue) or mesenchymal (red) transcriptional program. Both “STAD Normal + GTEx data” and “STAD Tumor data” are included in the analysis. See main text for details. TPM, transcripts per million.

