FIGURE 4.
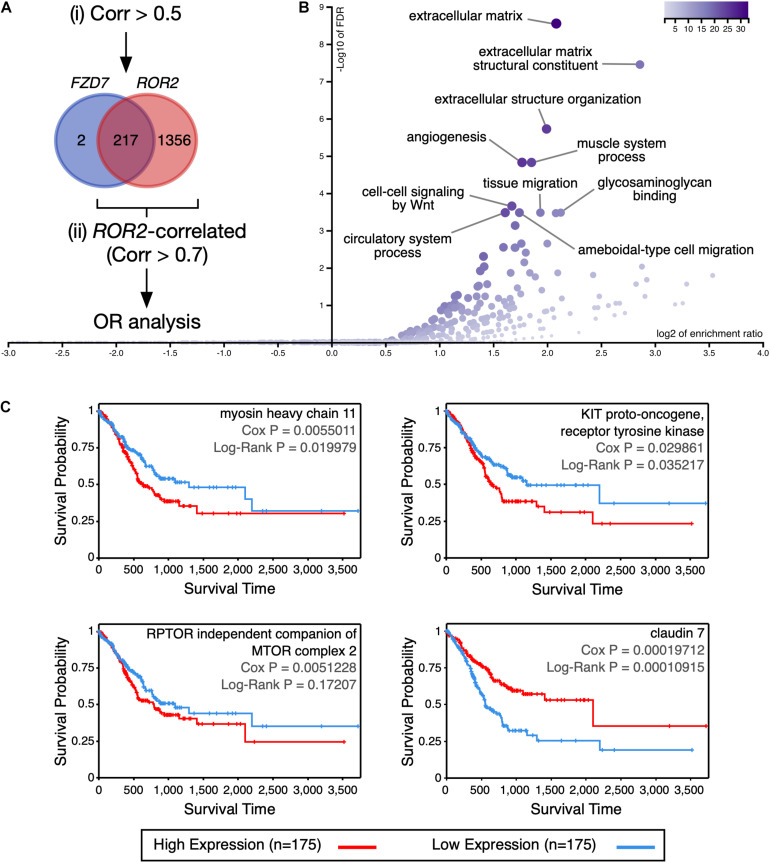
Analysis of genes and proteins correlated with FZD7/ROR2 expression. (A) Venn diagram showing the overlap between the genes positively correlated with either FZD7 or ROR2 gene expression. For simplicity, the size of the circles is not proportional to the number of genes. The rationale of the analysis is summarized in the diagram. (B) Volcano plot showing significantly over-represented (OR) Gene Ontology categories, according to WebGestalt. (C) Correlation between myosin heavy chain 11, KIT proto-oncogene, receptor tyrosine kinase, RPTOR independent companion of MTOR complex 2, and claudin 7 protein expression and survival, according to the TCPA database.

