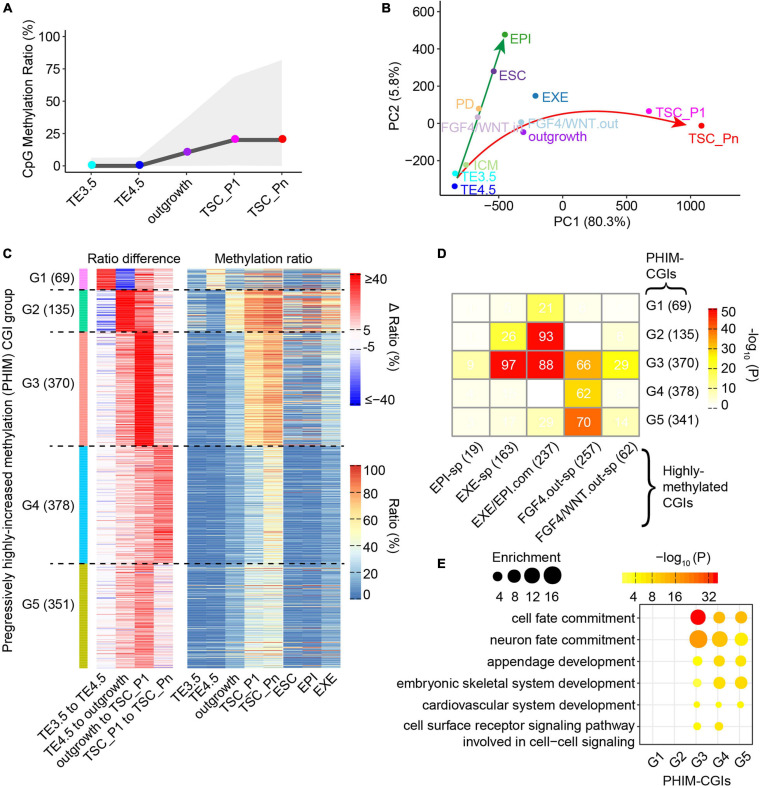
FIGURE 4.
Fibroblast growth factor 4 (FGF4) functions in methylation remodeling during TSC derivation. (A) CpG methylation levels at each stage of TSC derivation. The line indicates the medians. The shaded area represents the 25th to 75th percentiles. (B) Principal component analysis (PCA) of CpG island (CGI) methylation. The reduced representation bisulfite sequencing (RRBS) data of perturbingly cultured inner cell mass (ICM) are from GSE98963 (Smith et al., 2017). FGF4/WNT.in and FGF4/WNT.out represent the internal and outer part of the outgrowth derived from ICM cultured in the basal media supplemented with FGF4 and WNT agonist CHIR99021, respectively. FGF4 and CHIR99021 do not reach FGF4/WNT.in; FGF4/WNT.out, the outer layer of the outgrowth, responded to FGF4 and CHIR99021. PD represents ICM cultured in the basal media supplemented with MAPKK or MEK inhibitor PD0325901 and FGF4. The RRBS data of ESCs are from GSE47343 (Guo et al., 2013). (C) Heat maps showing K-mean clustering of the PHIM-CGIs during TSC derivation, whose DNA methylation level difference between adjacent stages is larger than 25%. Left heatmap showing CGI DNA methylation level difference between adjacent stages. Right heatmap showing CGI DNA methylation levels in each sample. (D) A heat map showing the intersection between the PHIM-CGIs (C) and the highly methylated CGIs (>0.25). Filled colors indicate the significance of the intersection (hypergeometric test). Numbers indicate CGI count. “EXE/EPI-com” denotes the CGIs that are highly methylated in both EXE and EPI. “EXE-specific” and “EPI-specific” denote the CGIs that are highly methylated specifically in EXE and EPI, respectively. “FGF4.out-sp” denotes the CGIs that are highly methylated in ICM treated with FGF4 but not in EXE and EPI. “FGF4/WNT.out-sp” denotes the CGIs that are highly methylated in outgrowth outer layers derived from ICM treated with FGF4 and WNT agonist CHIR99021 but not in EXE and EPI. (E) Bubble plots showing the gene ontology (GO) terms significantly enriched in the PHIM-CGIs (C).

