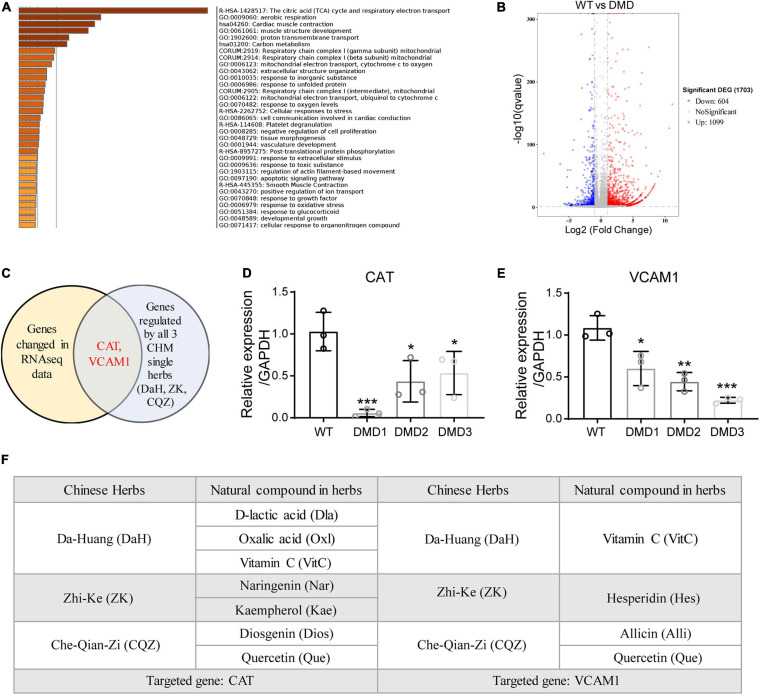
FIGURE 3.
Identification of CAT and VCAM1 as therapeutic targets for DaH, ZK, and CQZ. (A) GO term analysis of differentially expressed genes between WT and DMD hiPSC-CMs. Top enrichment clusters were shown, discrete color scale represented statistical significance. (B) Volcano plot of differentially expressed genes between WT and DMD hiPSC-CMs. (C) Venn diagram showing overlapping genes between differentially expressed gene list and CHM target genes. Relative expression of (D) CAT and (E) VCAM1 were measured by RT-qPCR (n = 3). *P < 0.05, **P < 0.01, and ***P < 0.001. (F) Summary of active compounds in DaH, ZK, and CQZ targeting CAT and VCAM1, respectively.

