FIGURE 8.
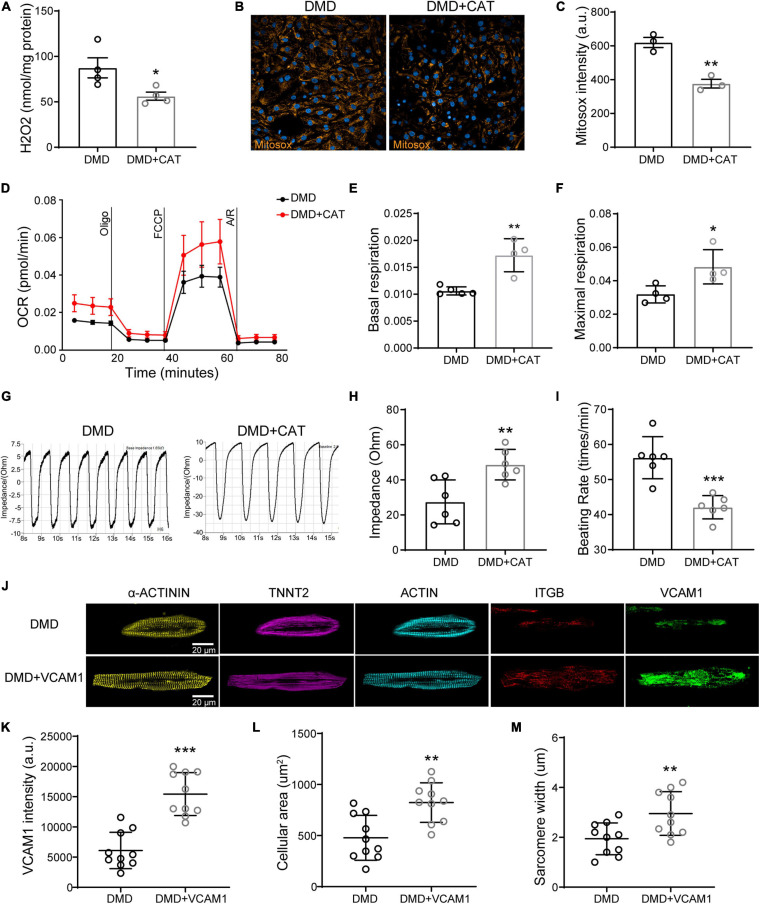
Overexpression of CAT or VCAM1 in DMD hiPSC-CMs. (A) H2O2 levels, (B) Mitosox, and (C) mitochondrial ROS levels were quantified in DMD hiPSC-CMs overexpressing CAT. (D) Mitochondrial respiration was measured in CAT overexpressing DMD hiPSC-CMs. (E) Quantification of basal respiration and (F) maximal respiration. (G) Representative impedance traces of monolayer DMD hiPSC-CMs treated with CAT lentivirus or control and quantification of the (H) impedance and (I) beating rate (n = 6). **P < 0.01 and ***P < 0.001. (J) Immunofluorescence micrographs of focal adhesion related proteins and VCAM1. Quantification of (K) VCAM1 levels, (L) cell size, and (M) sarcomere length in DMD hiPSC-CMs treated with CAT lentivirus or control (n = 10). *P < 0.05, **P < 0.01, and ***P < 0.001.

