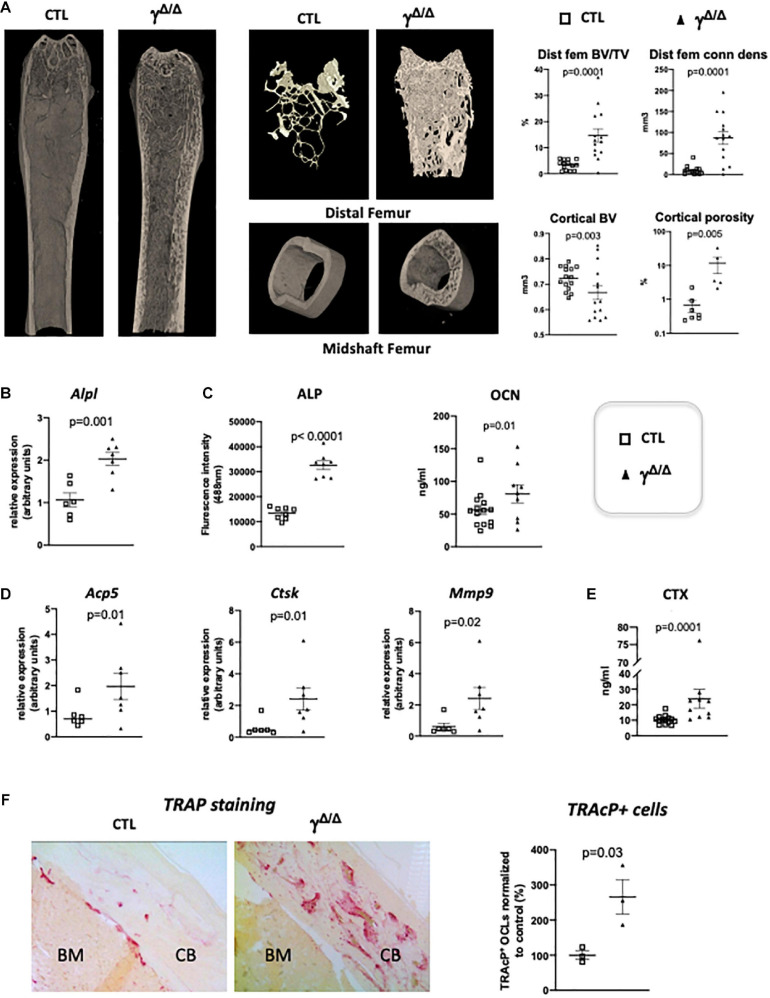
FIGURE 1.
Epiblastic PPARγ-deletion induces trabecular and cortical bone alteration. (A) Micro-CT analysis of femur from PpargΔ/Δ (γΔ/Δ) one-year old female mice or control female littermates (CTL). Dot plots on the right show for the different genotypes (empty square for CTL and black triangle for γΔ/Δ) the percentage bone volume/trabecular volume (BV/TV) in % and connectivity density (ConnDens) of distal femoral trabecular bone (upper panels), and the cortical bone volume (BV) in mm3 and the percentage of cortical porosity of femur (lower panels). All mice were 1-year-old. (B) RT-qPCR analysis of Alkaline phosphatase (AlpI) gene expression in femur from CTL and γΔ/Δ. (C) ELISA measurements of serum Alkaline phosphatase (ALP) and osteocalcin (OCN). (D) RT-qPCR analysis of Acid Phosphatase 5-Tartrate Resistant (Acp5), Cathepsin K (Ctsk), and Matrix Metallopeptidase 9 (Mmp9) expression in femur from CTL and γΔ/Δ. (E) ELISA measurements of serum Carboxy-terminal Collagen I telopeptide (CTX). (F) Representative images of TRAcP staining of decalcified sections of femurs, at mid-shaft levels, from control (CTL) or PpargΔ/Δ (γΔ/Δ) mice. CB, cortical bone; BM, bone marrow. Data are presented as mean ± S.E.M. Each dot represents an individual animal. Statistical significance was determined by two-tailed unpaired t-test.

