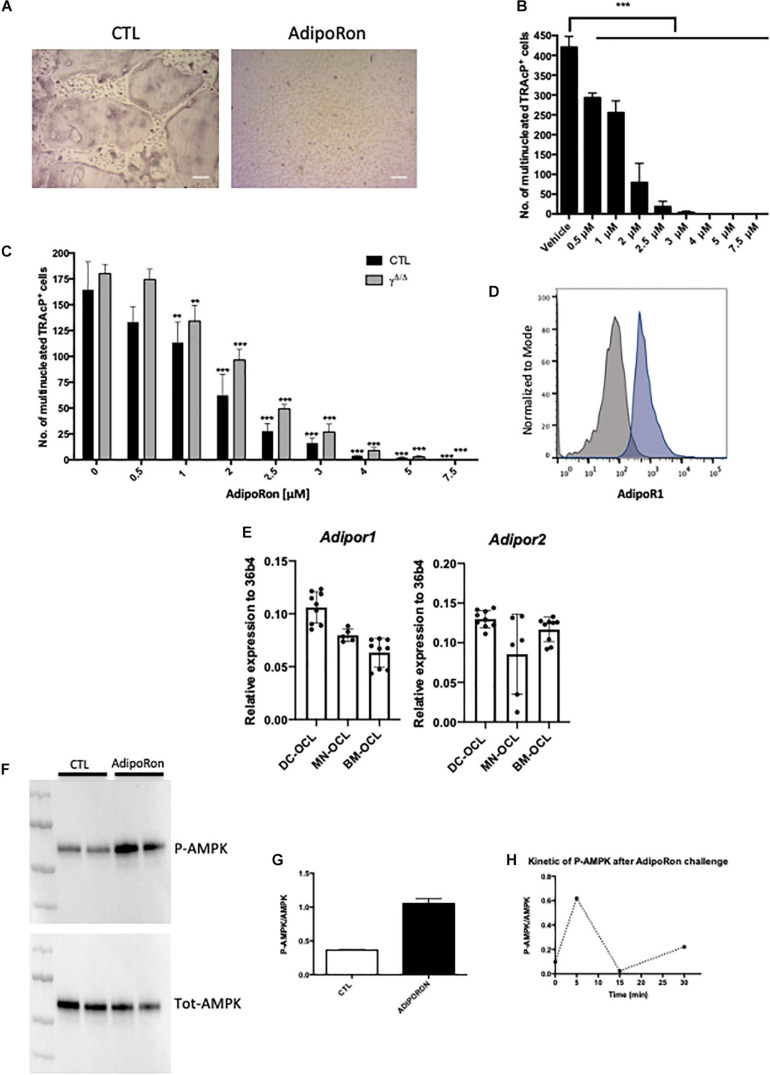
FIGURE 4.
Adiponectin signalling activation blocks osteoclast differentiation. (A) Representative images of TRAcP stained BM-derived osteoclasts differentiated in the presence or absence of AdipoRon (5 μM). Scale bars = 100 μm. (B) Dose response effect of AdipoRon on osteoclast differentiation using RAW264.7 cells (n = 3). (C) Effect of AdipoRon on osteoclast differentiation assay using bone marrow cells from PpargΔ/Δ (γΔ/Δ, grey bars) mice and control littermates (CTL, black bars). (D) Expression of Type 1 Adiponectin Receptor (AdipoR1) at the surface of BM- derived osteoclasts demonstrated by flow cytometry. Grey curve represents unstained negative control; blue curve represents BM-derived osteoclasts. (E) RT-qPCR analysis of Adiponectin Receptor 1 and 2 (Adipor1 and Adipor2) on osteoclasts differentiated from bone marrow (BM) cells (BM-OCL), from BM-derived dendritic cells (DC-OCL) and BM monocytic cells (MN-OCLs). (F) Western-blot analysis of sorted mature bone marrow-derived osteoclasts treated with AdipoRon (5 μM). AdipoRon treatment activates AMPK phosphorylation (p-AMPK) in murine BM-derived osteoclasts. (G) Ratio of P-AMPK over total AMPK measured by densitometry. (H) Kinetic of AMPK phosphorylation (P-AMPK) after AdipoRon challenge in RAW264.7-derived osteoclasts. Data are presented as mean ± S.E.M. Statistical significance was determined by two-tailed unpaired t-test. ∗∗p < 0.01, ∗∗∗p < 0.001.

