FIGURE 5.
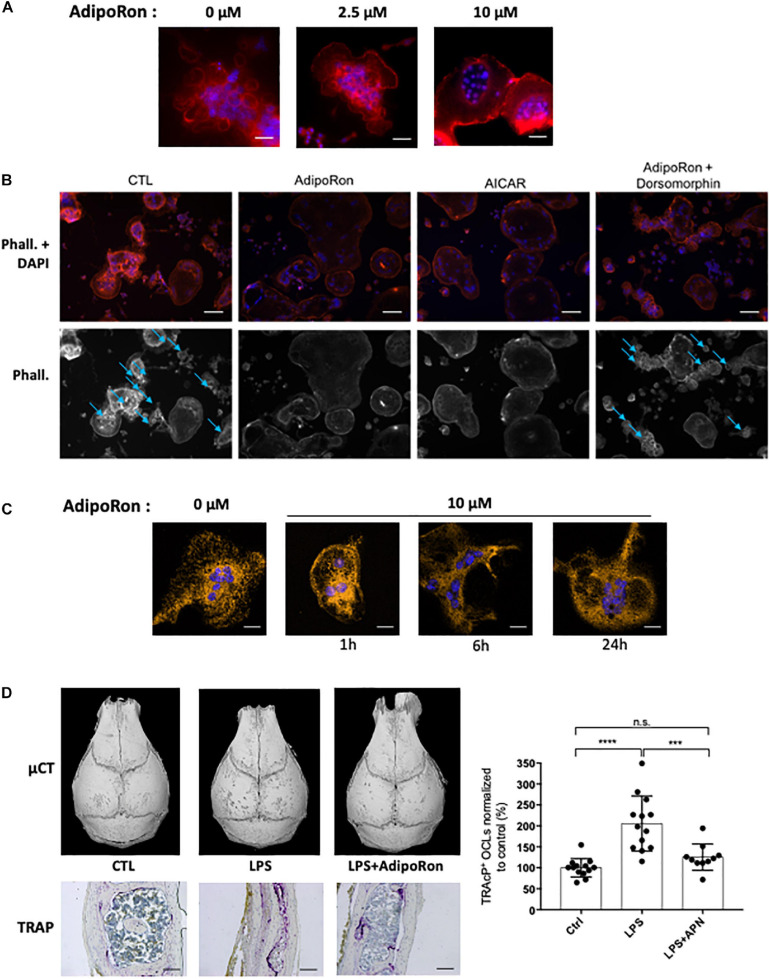
Adiponectin regulates OCL activity and podosome formation. (A) Confocal microscopy of phalloidin-marked podosomes in RAW264.7-OCL in the presence of increasing concentrations of AdipoRon (representative images of n = 3 per concentration) Scale bars = 100 μm. (B) Confocal microscopy of phalloidin-marked podosomes in the presence of AMPK modulating drugs (AdipoRon, 10 μM; AICAR, 50 nM; Dorsomorphin, 1.2 μM) (representative image of n = 3 per conditions white asterisks marking the podosomes). Scale bars = 50 μm. Blue arrows indicate podosome rings. (C) Confocal microscopy of MitoTracker Orange in mature RAW264.7-OCL after AdipoRon (10 μM) challenge at different time points. Scale bars = 20 μm. (D) Mice received daily s.c. injections on the calvaria. Mice were injected with either 100 μg lipopolysaccharide from Salmonella abortus equi (LPS), or 100 μg LPS + 500 ng AdipoRon (LPS + AdipoRon) or vehicle (PBS) injection (control, CTL). Mouse skulls were collected on the 3rd day (n = 3 animals per group); Top panels: Micro-CT of the mouse skulls; Bottom panels: TRAcP staining of mouse skull after LPS +/− AdipoRon challenge, (representative sections from 3 animals per group), scale bars = 100 μm. Right panel: quantification of the TRAcP staining. Two-group comparisons were performed using the Student’s t-test. ∗∗∗p < 0.001, ∗∗∗∗p < 0.0001.

