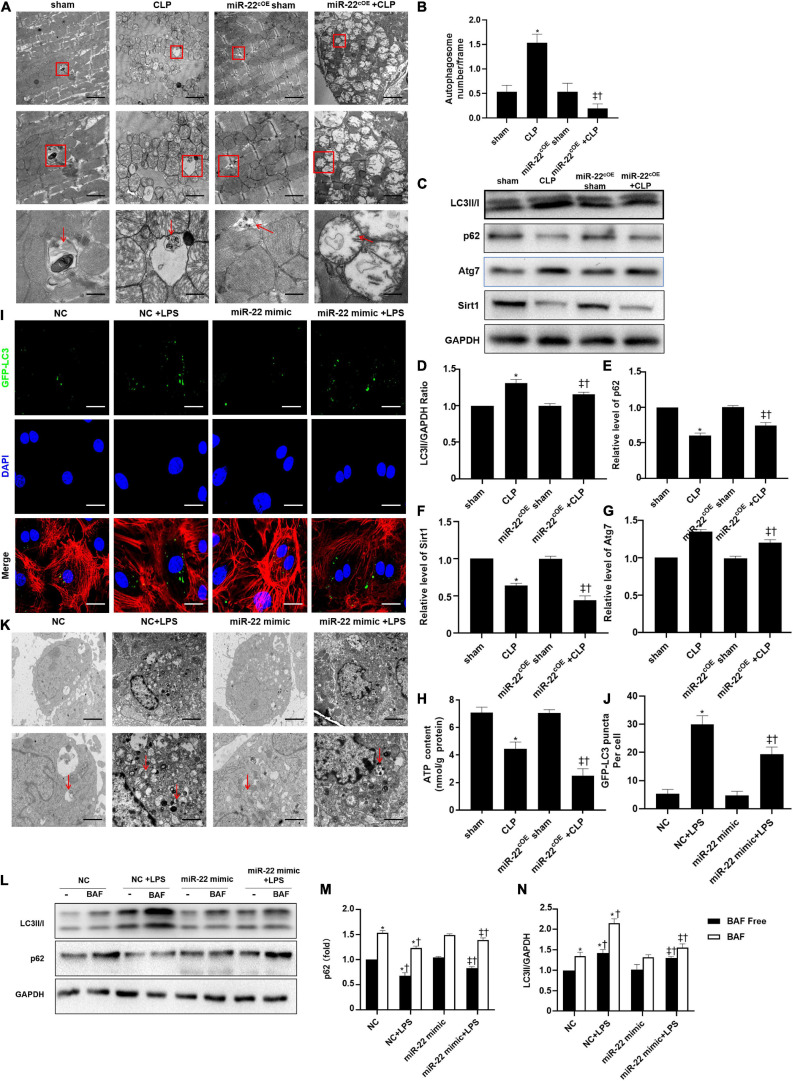
FIGURE 6.
Overexpressing miR-22 reduces autophagy levels in CLP-induced cardiomyopathic myocardium and inhibits autophagic flux in vitro in the presence of LPS. (A) Representative images of myocardial mitochondria ultrastructural morphology that underwent different treatments. (B) Quantity of autophagosomes. (C) Representative images of blots. (D) LC3-II/GAPDH ratio. (E) Relative p62 protein level ratio. (F) Relative sirt1 protein level ratio. (G) Relative Atg7 protein level ratio; Data were expressed as mean ± SEM. ∗P < 0.05 vs. sham group; ‡P < 0.05 vs. CLP group; †P < 0.05 vs. miR-22cOE sham group. (H) ATP content (n = 6). (I,J) Representative images and quantitative analysis of GFP-LC3 puncta; Scale bar = 20 μm. (K) Representative images of mitochondria in neonatal mice cardiomyocytes. (L–N) Relative p62 protein level ratio with or without bafilomycin A1 treatment in condition of LPS; LC3-II/GAPDH ratio with or without bafilomycin A1 treatment in condition of LPS. ∗P < 0.05 vs. NC group; ‡P < 0.05 vs. NC + LPS group; †P < 0.05 vs. miR-22 mimic group. All the experiments were repeated three times.

