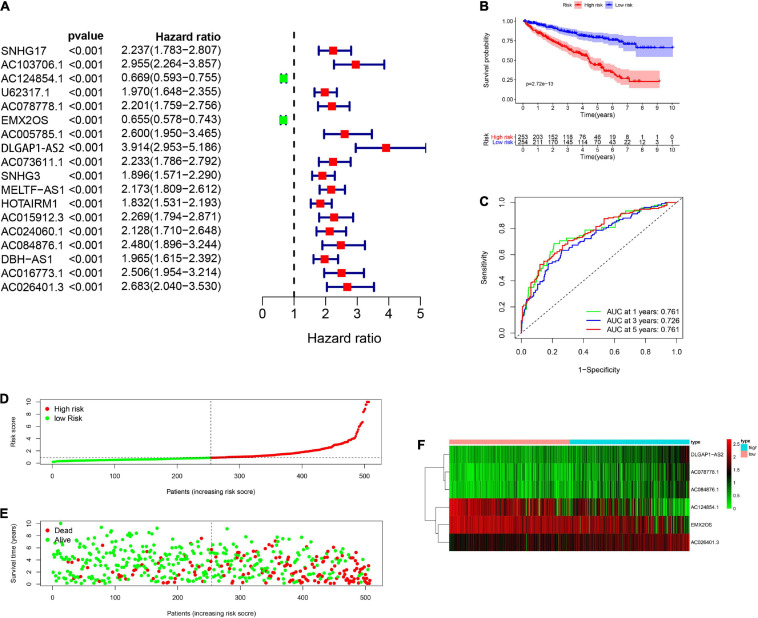
FIGURE 1.
Construction and verification of glycolysis-related lncRNAs prognostic signatures in RCC patients. (A) The univariate Cox regression analysis combining the clinical surviving statistics exhibit that expression of 18 lncRNAs significantly correlated with OS of RCC patients. (B) Kaplan-Meier survival curve analysis shows that the significantly different survival time between the low-risk and the high-risk group. (C) ROC curve indicate the reliability of applying the risk score to predict the prognosis of RCC patients. (D) Distribution of high-risk and low-risk patients with renal cell carcinoma based on the glycolysis-related lncRNAs prognosis signature. (E) The scatter dot plot shows that the relationship between survival rates of the RCC patients and the risk score. (F) The heatmap shows the different expression of prognostic signature-related lncRNAs in different risk groups.

