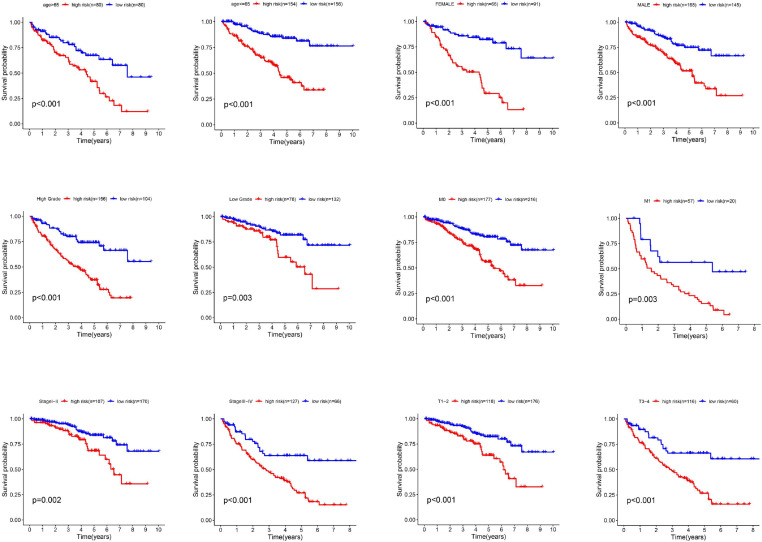
FIGURE 4.
The different survival time of high- and low-risk groups classified by clinicopathological parameters. The Kaplan-Meier survival curve analysis shows that the correlation of risk score and OS among the patients with different characteristics such as age > 65 or age < 65, female or male, high grade or low grade, metastasis or non-metastasis, advanced-stage (Stage III–IV) or early stage (Stage I–II) and T1-2 or T3-4.

