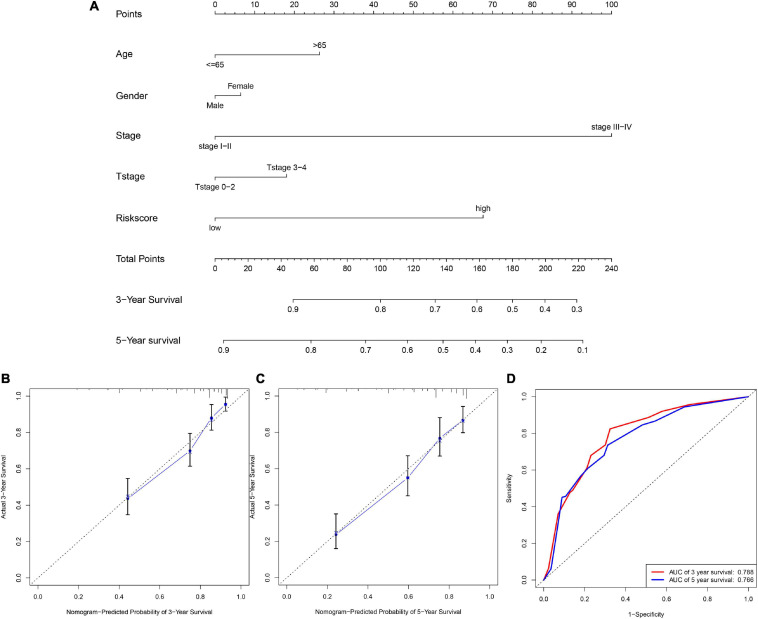
FIGURE 5.
The nomogram based on clinicalpathological parameters and risk score. (A) The nomogram shows that the risk score accurately estimate the 3-, and 5-year survival time. (B,C) Calibration curves elucidate the concordance between predicted and observed 3- and 5-year OS of RCC patients. (D) ROC curve shows the AUC values (0.788 and 0.766) of 3- and 5-year survival.

