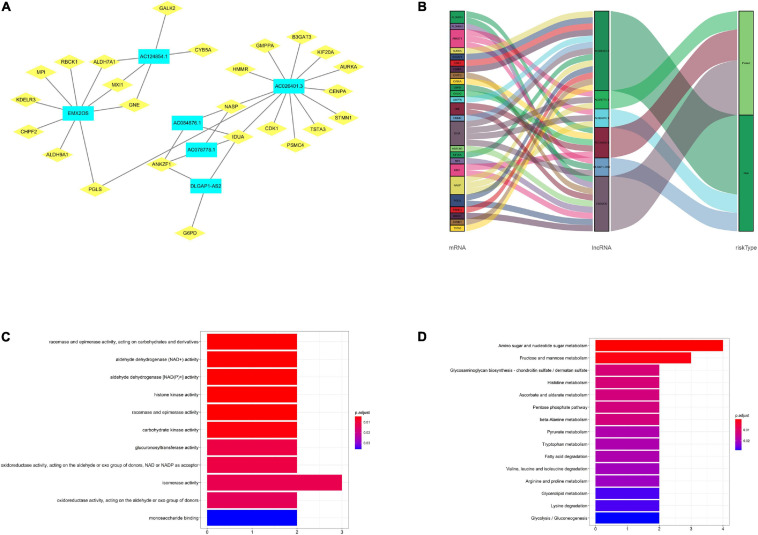
FIGURE 7.
Construction and analysis of the lncRNA-mRNA co-expression network. (A) The diagram shows 36 lncRNA-mRNA links among 6 lncRNAs and 25 related mRNAs. (B) The Sankey diagram exhibited the correlation between the 25 mRNAs and 6 lncRNAs (risk/protective). (C) The GO term shows the enriched molecular biological metabolic processes. (D) The KEGG pathway analysis shows the significantly enriched pathways.

