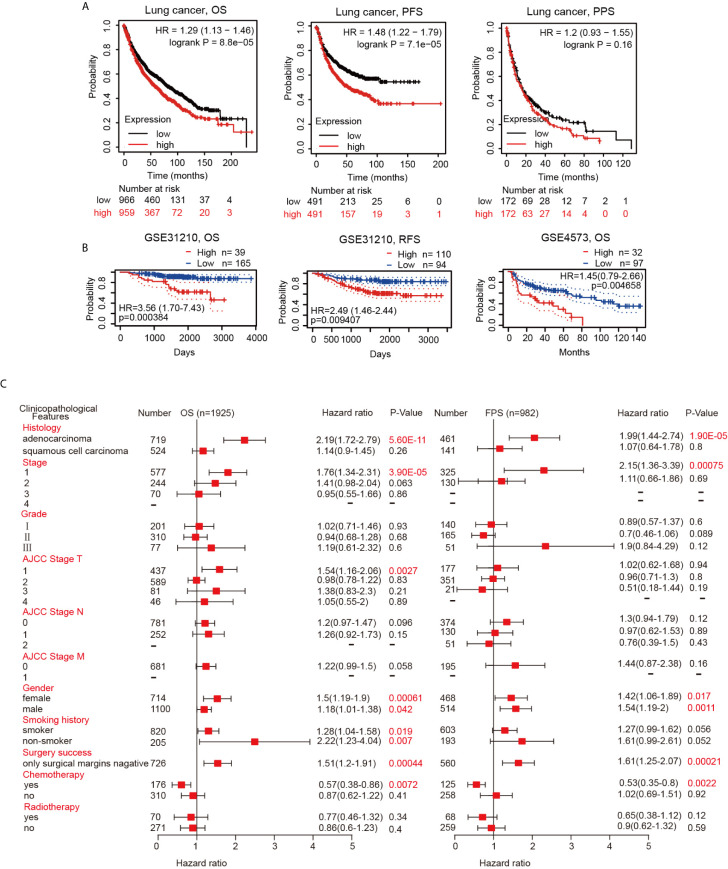
Figure 4.
Survival curve evaluating the prognostic value of hepcidin. (A) Survival curves using the Kaplan-Meier plotter are shown for OS, PFS and PPS. (B) Survival curves using the PrognoScan database are shown for OS and RFS. (C) A forest plot shows the correlation between hepcidin expression and clinicopathological parameters in LUAD and LUSC patients.

