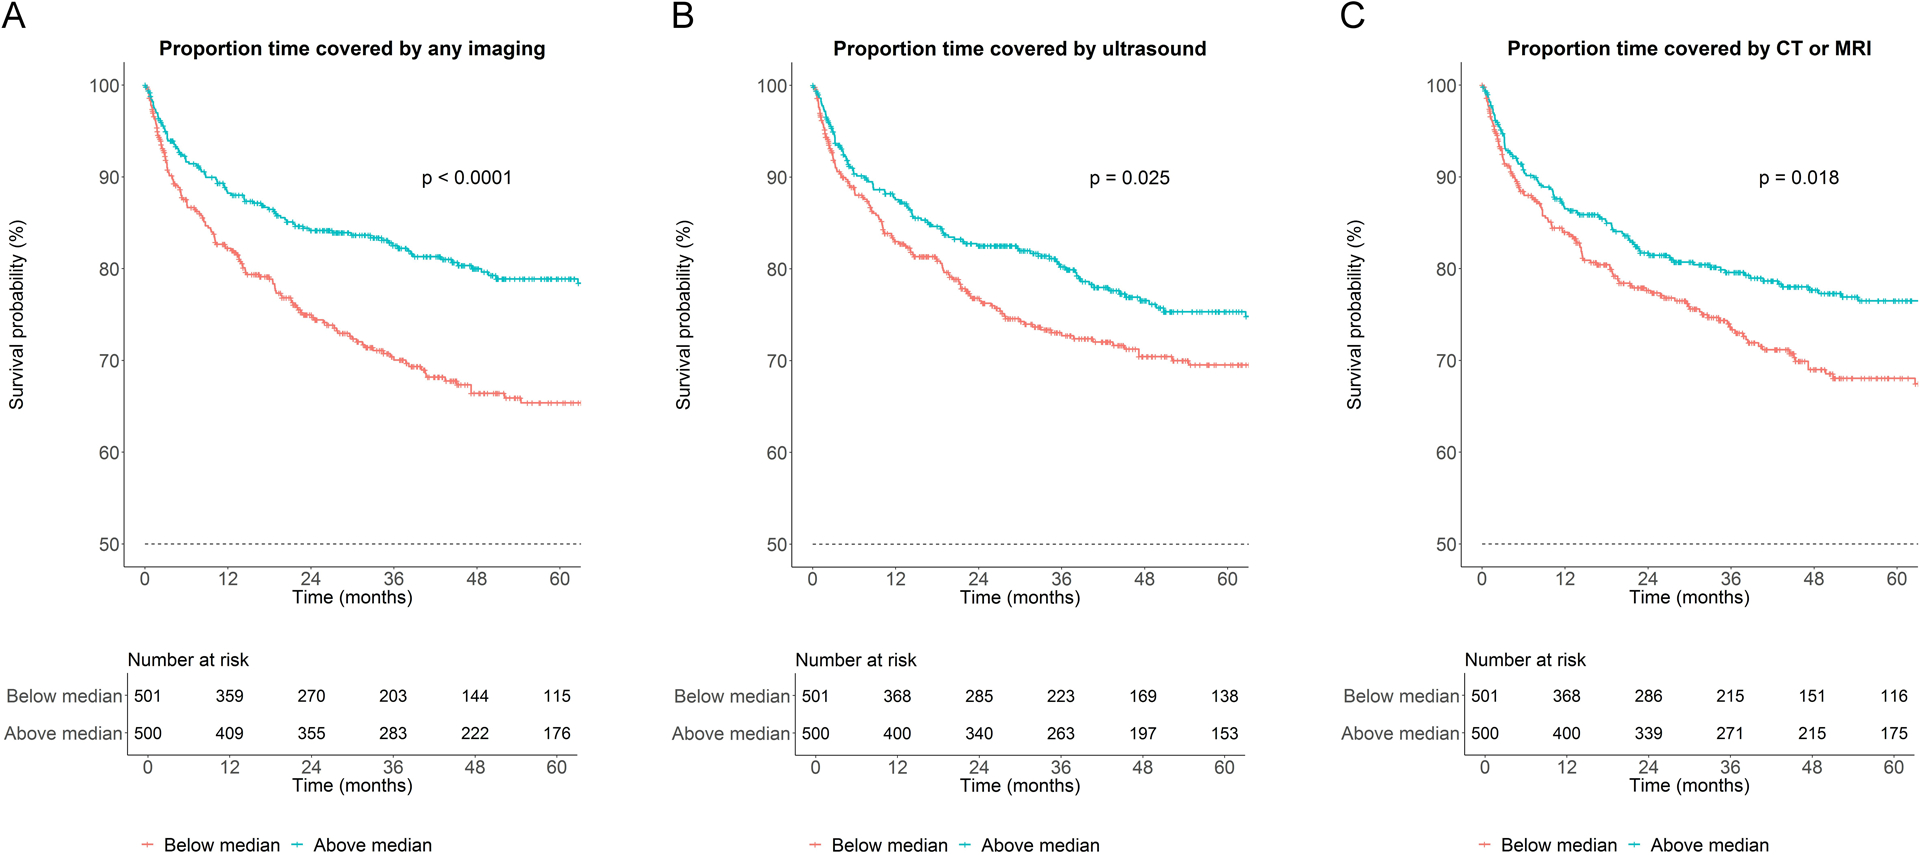
Figure 2:

Survival based on proportion time covered by surveillance. Kaplan-Meier curves depicting survival based on proportion time covered by (A) any imaging, (B) ultrasound, or (C) computed tomography (CT) or magnetic resonance imaging (MRI).

Survival based on proportion time covered by surveillance. Kaplan-Meier curves depicting survival based on proportion time covered by (A) any imaging, (B) ultrasound, or (C) computed tomography (CT) or magnetic resonance imaging (MRI).