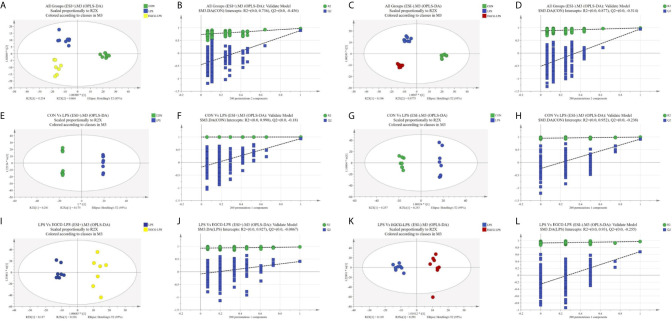
Figure 7.
Plots of the multivariate statistical comparisons between groups. (A) OPLS-DA score plot of all groups (ESI+); (B) OPLS-DA (Validate Model) score plot of all groups (ESI+); (C) OPLS-DA score plot of all groups (ESI-); (D) OPLS-DA (Validate Model) score plot of all groups (ESI-); (E) OPLS-DA score plot of CON Vs LPS (ESI+); (F) OPLS-DA (Validate Model) score plot of CON Vs LPS (ESI+); (G) OPLS-DA score plot of CON Vs LPS (ESI-); (H) OPLS-DA (Validate Model) score plot of CON Vs LPS (ESI-); (I) OPLS-DA score plot of LPS Vs LPS-EGCG (ESI+); (J) OPLS-DA (Validate Model) score plot of LPS Vs LPS-EGCG (ESI+); (K) OPLS-DA score plot of LPS Vs LPS-EGCG (ESI-); (L) OPLS-DA (Validate Model) score plot of LPS Vs LPS-EGCG (ESI-).

