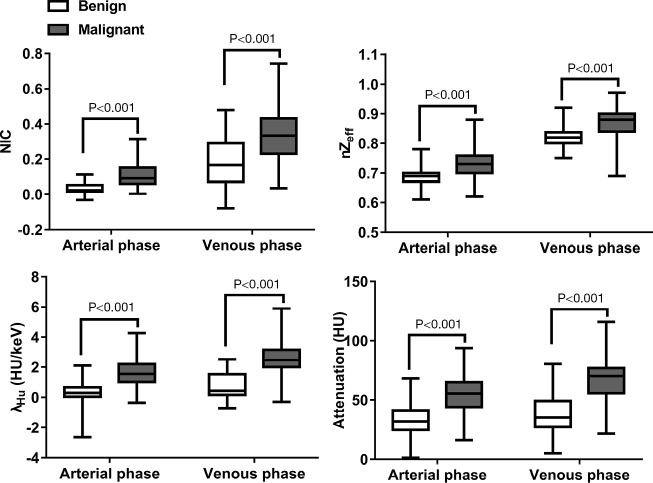
Figure 2.
Box-and-whisker plots presenting the distributions of NIC, λHu, nZeff, and attenuation in the arterial and venous phases between benign (n=44) and malignant (n=117) lesions of the breast, respectively. Continuous data were compared using the Welch’s t-test for normal distributions and using the Mann-Whitney U-test for non-normal distributions. NIC, normalized iodine concentration; nZeff, normalized effective atomic number; λHu, slope of the spectral Hounsfield unit curve; HU, Hounsfield unit.

