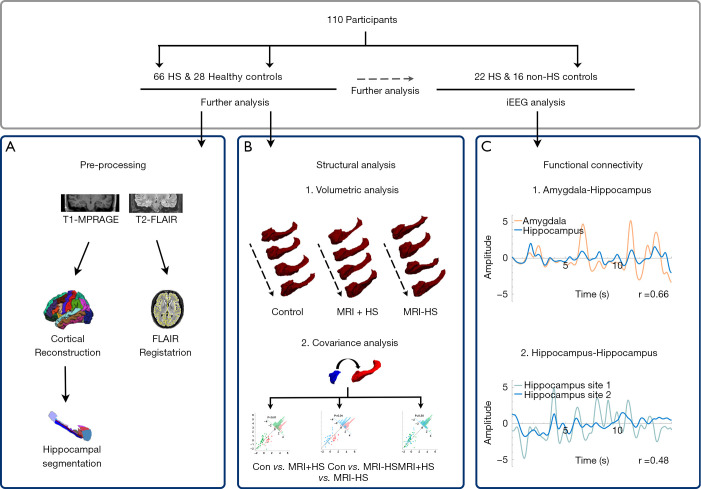
Figure 1.
Schematic outline of the study. In total, 110 participants were included for neuroimaging analysis and 38 for SEEG analysis. (A) Neuroimage preprocessing and quantitative features extraction, including cortical reconstruction of T1-MPRAGE images, co-registration of T2-FLAIR images, and hippocampal segmentation. (B) Structural analysis. This involved volumetric analysis and structural covariance analysis. (C) Functional connectivity analysis. This was conducted between the amygdala and hippocampus (amygdala-hippocampal connectivity) and between two regions within the hippocampus (intra-hippocampal connectivity). HS, hippocampal sclerosis; Con, healthy control group; MRI + HS, MRI-positive HS patient group; MRI-HS, MRI-negative HS patient group.

