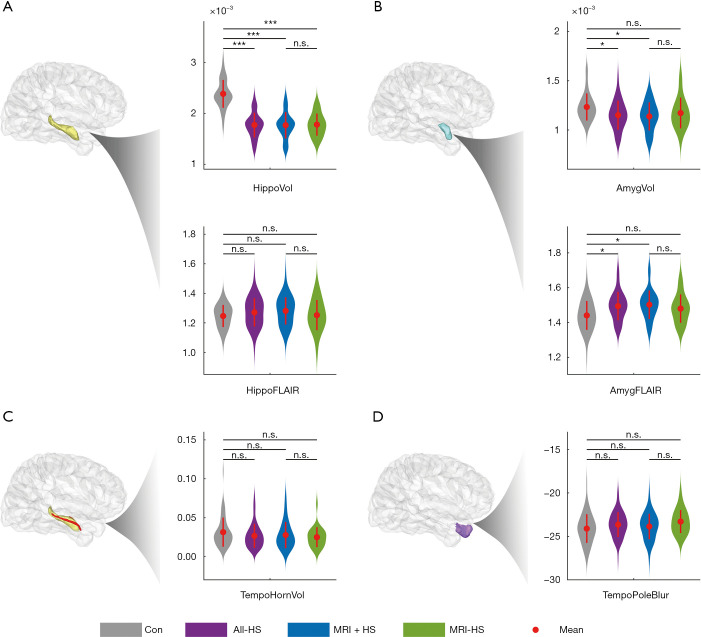
Figure 2.
Structural features in controls and ipsilateral side of HS patients including MRI-positive and MRI-negative subgroups. (A) Normalized hippocampal volume and FLAIR signal intensity; (B) normalized amygdala volume and FLAIR signal intensity; (C) normalized temporal horn volume; (D) Gray-white matter blurring in the temporal pole. The red lines represent the mean values (solid circles) and standard deviations (two ends); *: P<0.05; ***: P<0.001; n.s.: non-significant. All P values were adjusted for multiple comparison using the FDR method. HippoVol, normalized volume of hippocampus; HippoFLAIR, normalized FLAIR signal intensity of hippocampus; AmygVol: normalized volume of Amygdala; AmygFLAIR, normalized FLAIR signal intensity of amygdala; TempoHornVol, normalized volume of temporal horn of lateral ventricle; TempoPoleBlur, GM/WM boundary blurring in the temporal pole; Con, control group; MRI + HS, MRI-positive HS patient group; MRI-HS, MRI-negative HS patient group.

